
Understanding Robust Estimation Methods for Handling Outliers in Data Analysis
This content delves into the importance of robust estimation in dealing with outliers in data analysis. It covers topics such as moving averages, the impact of outliers, reasons for outlier occurrence, and the robustness of median compared to mean calculations. Additionally, it explores moving media
1 views • 34 slides

Improving Multi-Link Power Management Efficiency in IEEE 802.11 Networks
The document discusses challenges with per-link power mode changes in multi-link scenarios in IEEE 802.11 networks, proposing a solution for more efficient power management. It addresses issues such as latency and inefficiencies in signaling for power mode changes, introducing scheduled multi-link p
6 views • 9 slides
Understanding Histograms: Ratios, Rates & Statistics
Explore the world of histograms to analyze data sets efficiently. Learn how to interpret dot plots, find mean, median, and mode, and create histograms. Understand key terms like frequency tables and intervals. Practice identifying the range of data, calculating mean values, and reading histograms ef
0 views • 15 slides

Understanding Mean, Median, and Mode in Data Analysis
Explore the concepts of mean, median, and mode in data analysis through engaging visuals and interactive exercises. Learn about the different types of averages, how to calculate them, and their significance in understanding datasets. Practice finding the mean of various sets of data and solve real-w
0 views • 10 slides

Analysis of Gender Pay Gap Reporting at Oxford Health NHS FT as of March 2019
The Gender Pay Gap report at Oxford Health NHS FT covers key aspects including mean and median gender pay gaps in hourly pay, bonus gaps, proportion of employees receiving bonuses, and proportion of males and females in each pay quartile. The report also highlights workforce gender distribution, Age
0 views • 17 slides
Understanding Measures of Center in Data Analysis
This lesson explores the concept of measuring the center of a distribution of quantitative data using the median and the mean. It covers how to find and interpret the median, calculate the mean, compare both measures, and choose the appropriate measure of center. Practical examples and explanations
0 views • 15 slides

Understanding Measures of Central Tendency in Statistics
Measures of central tendency, such as mean, median, and mode, provide a way to find the average or central value in a statistical series. These measures help in simplifying data analysis and drawing meaningful conclusions. The arithmetic mean, median, and mode are commonly used to represent the over
0 views • 11 slides
Understanding Measures of Center and Spread in Data Analysis
Explore the concept of measures of center and spread through dot plots depicting the number of hours students watch TV on Saturdays. Engage in vocabulary review to grasp key terms like mean, median, mode, range, outlier, and distribution. Understand how to interpret data by observing and examining d
0 views • 21 slides

Understanding Measures of Central Tendency in Statistics
Measures of central tendency, such as mean, median, and mode, play a crucial role in statistical analysis by describing the central position in a dataset. Mean represents the average, median is the middlemost value, while mode is the most frequent value. Learn about their significance, calculation m
1 views • 12 slides
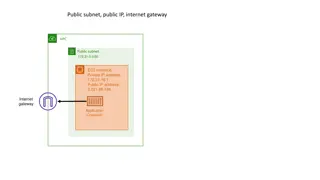
Networking Modes in AWS VPC Environments
Explore different networking modes such as Bridge mode with static mapping, Bridge mode with dynamic mapping, and AWS VPC networking mode in an AWS VPC environment with various configurations and scenarios.
0 views • 18 slides

Understanding Mode-S Radar Operations and Identifiers
This simplified explanation delves into the fundamental principles of radar operations, focusing on Primary and Secondary radar systems, including Mode A/C and Mode S functionalities. It covers radar interrogation, replies, and the significance of radar identifiers (II and SI codes) in managing over
0 views • 19 slides

Parallel Implementation of Multivariate Empirical Mode Decomposition on GPU
Empirical Mode Decomposition (EMD) is a signal processing technique used for separating different oscillation modes in a time series signal. This paper explores the parallel implementation of Multivariate Empirical Mode Decomposition (MEMD) on GPU, discussing numerical steps, implementation details,
1 views • 15 slides

Understanding Normal Distribution and Its Business Applications
Normal distribution, also known as Gaussian distribution, is a symmetric probability distribution where data near the mean are more common. It is crucial in statistics as it fits various natural phenomena. This distribution is symmetric around the mean, with equal mean, median, and mode, and denser
1 views • 8 slides

Patch Bundle Mode Walkthrough for Device Configuration
Explore the Patch Bundle Mode walkthrough consisting of flowcharts and pseudo code examples for controlling a device's patch mode, downloading configurations, and changing device modes. The content provides a detailed guide on using commands to initiate patch burst mode, specify I2C addresses, and t
0 views • 4 slides

Dealing with Range Anxiety in Mean Estimation
Dealing with range anxiety in mean estimation involves exploring methods to improve accuracy when estimating the mean value of a random variable based on sampled data. Various techniques such as quantile truncation, quantile estimation, and reducing dynamic range are discussed. The goal is to reduce
1 views • 12 slides
Exploring Descriptive Statistics: Understanding Data through Stories
This lesson introduces the importance of statistics in understanding data narratives. From calculating mean, median, mode, and range to visual representations like dot plots, histograms, and box plots, students delve into exploring stories hidden within data sets. The classwork involves Khan Academy
1 views • 51 slides

Understanding Basic Statistics in Research and Evidence-Based Practice
Basic statistics play a crucial role in research and evidence-based practice. Descriptive statistics help summarize data, while inferential statistics make inferences about populations based on samples. Various types of statistics like hypothesis testing, correlation, confidence intervals, and signi
3 views • 15 slides
Understanding Measures of Central Tendencies and Norms in Test Evaluation
Exploring topics such as measures of central tendencies (mean, median, mode), variability, understanding raw scores, standardization samples, norms in test evaluation, and types of evaluation protocols. Learn about developing norms, derived score interpretation, and the significance of evaluation me
7 views • 35 slides

Understanding the Normal Probability Curve
The Normal Probability Curve, also known as the normal distribution, is a fundamental concept in statistics. It is symmetric around the mean, with key characteristics such as equal numbers of cases above and below the mean, and the mean, median, and mode coinciding. The curve's height decreases grad
0 views • 10 slides
Understanding Key Statistics Concepts in Data Analysis
Explore the essential statistics concepts including mean, median, mode, variance, standard deviation, skewness, and how they are computed for both discrete and continuous data sets. Learn the importance of these measures in analyzing data and making informed decisions.
0 views • 11 slides

Study on Work-Related Musculoskeletal Disorders and Median Nerve Entrapment in Upper Limb
Investigating the prevalence, factors, and treatment options for work-related musculoskeletal disorders, focusing on median nerve entrapment in the upper limb. The study aims to provide insights into this condition through a thorough literature review and research objectives.
1 views • 31 slides

Understanding Fair Distribution of Sweets: Analysis & Comparison
Explore the concept of fair distribution through sweets, assessing mean, median, and variability. Engage in activities to make distributions fair by moving items and determining the most equitable distribution among different scenarios. Analyze various distributions of sweets among students and iden
1 views • 35 slides
Understanding CMRR in Differential Amplifiers
Differential input amplifiers, including operational, instrumentation, and difference amplifiers, play a crucial role in amplifying differential signals while rejecting common-mode noise. The Common-Mode Rejection Ratio (CMRR) is a key parameter in these amplifiers, indicating their ability to suppr
0 views • 48 slides
Functions of Random Variables and Sampling Distributions
This chapter delves into the functions of random variables and sampling distributions. It covers important statistics like populations, samples, and measures of central tendency such as the mean and median. Properties of these measures are discussed, along with examples illustrating their calculatio
0 views • 39 slides

Sports Official Selection and Evaluation Process Overview
The process for selecting and evaluating sports officials involves various steps such as rating on a 1-5 scale, calculating mean, median, and mode of ratings, and voting by coaches and associations. Athletic Directors play a crucial role in submitting their ballots at the end of the season. Official
0 views • 23 slides

Officiating Guidelines and Evaluation Process for Various Sports
Guidelines for evaluating and selecting officials in sports like baseball, basketball, football, lacrosse, soccer, softball, volleyball, and wrestling are outlined. The process involves rating officials on a scale of 1-5, calculating mean, median, and mode of ratings, and considering votes from coac
0 views • 24 slides

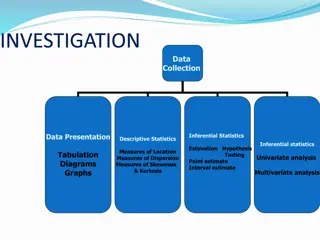
Statistical Analysis: Descriptive and Inferential Techniques Overview
Understanding statistical analysis involves both descriptive and inferential techniques. Descriptive statistics focus on summarizing data, including measures of central tendency and dispersion. In contrast, inferential statistics use sample data to make inferences about populations and test hypothes
0 views • 19 slides
Understanding Measures of Central Tendency in Data Analysis
Measures of central tendency, including mean and median, play vital roles in summarizing and interpreting data. The mean is the average calculated by summing all values and dividing by the count, while the median is the middle score when data is arranged in order. These measures provide insight into
0 views • 39 slides
Understanding User Mode, Kernel Mode, Interrupts, and System Calls in Computer Architecture
In modern computers following Von Newman Architecture, programs and data are stored in RAM. The CPU, RAM, ROM, and devices communicate via address and data buses. The system operates in both kernel and user modes, where kernel mode allows full system control, while user mode restricts access for sec
0 views • 29 slides
Parallel Computing Examples in CHARM++
Explore examples of parallel computing in CHARM++ including finding the median of data spread out over a chare array, sending elements to correct positions in a sorted array, and sorting elements using different techniques. Follow discussions and ideas for median finding in chares arrays and learn t
0 views • 15 slides
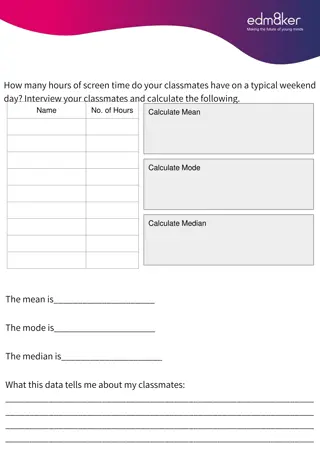
Insight into Classmates' Habits for a Brighter Future
The data gathered through interviews with classmates reveals insights into their screen time on weekends, books read in a month, daily water intake, and weekly physical activity levels. Mean, mode, and median calculations provide a comprehensive understanding of their habits, guiding towards a holis
0 views • 8 slides
Understanding Measures of Central Tendency in Math
In mathematics, the average, median, mode, and range are essential measures of central tendency used to organize and summarize data for better understanding. The mean refers to the middle value of a dataset without outliers, while the median is the middle number when the data is ordered. The mode re
0 views • 14 slides
Understanding Averages in Mathematics
Explore the concepts of mean, mode, and median, along with practical examples and puzzles involving these averages. Learn the importance of each average in different contexts and how to calculate them effectively. Dive into frequency tables and range calculations to deepen your understanding of stat
0 views • 14 slides

Understanding Arithmetic Mean Calculation Methods
Arithmetic mean can be calculated in individual, discrete, and continuous series. In individual series, each item is listed separately, while in discrete and continuous series, items are grouped with frequencies. The mean can be computed using formulas tailored to each type of series, including meth
0 views • 4 slides
Exploring Statistical Approaches in Global Issues Through Data
In this data-driven session for 11-14 year olds, topics like central tendency measures, honey production in Ethiopia, and grouped frequency diagrams are discussed. Understanding statistics through real-life examples such as honey cooperatives and collective action groups enhances learning and applic
0 views • 14 slides
Understanding Central Tendency and Variability in Distributions
Central tendency and variability are fundamental features of statistical distributions. Central tendency, encompassing mean, median, and mode, represents the middle of a distribution, while variability describes the spread of data points. Knowing the effect of distribution shape on these measures he
0 views • 25 slides
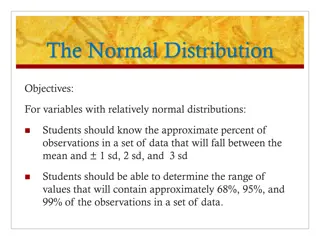
Understanding the Normal Distribution in Data Analysis
The normal distribution, also known as the bell-shaped or Gaussian distribution, is defined by the mean and standard deviation of quantitative data. It helps determine the range of values containing specific percentages of observations. Identifying frequency, probability, mean, and the relationship
0 views • 19 slides

Understanding C Programming: Arrays, Coding Practices, and File Organization
In this educational content, we delve into the concept of arrays in C programming and discuss a practical coding exercise involving finding the maximum, minimum, mean, variance, median, and mode of a list of values. We also cover important coding practices such as organizing C files, using header fi
0 views • 25 slides

Local MAC Address Assignment Protocol (LAAP) and 802.1CQ
The Local MAC Address Assignment Protocol (LAAP) in conjunction with 802.1CQ specifies protocols and procedures for locally unique assignment of MAC addresses in IEEE 802 networks. LAAP operates in two modes - Server Mode and Peer-to-Peer Mode, ensuring efficient allocation of MAC addresses while av
0 views • 15 slides

Analyzing Mean, Median, and Mode in School Data
Anne and Kate, two new students at the school, are analyzing their classmates' data to understand them better. Anne calculates averages of social media accounts, phone usage, and weekly spending, while Kate uses a stem-and-leaf diagram to analyze the number of people classmates talk to daily. Differ
0 views • 5 slides