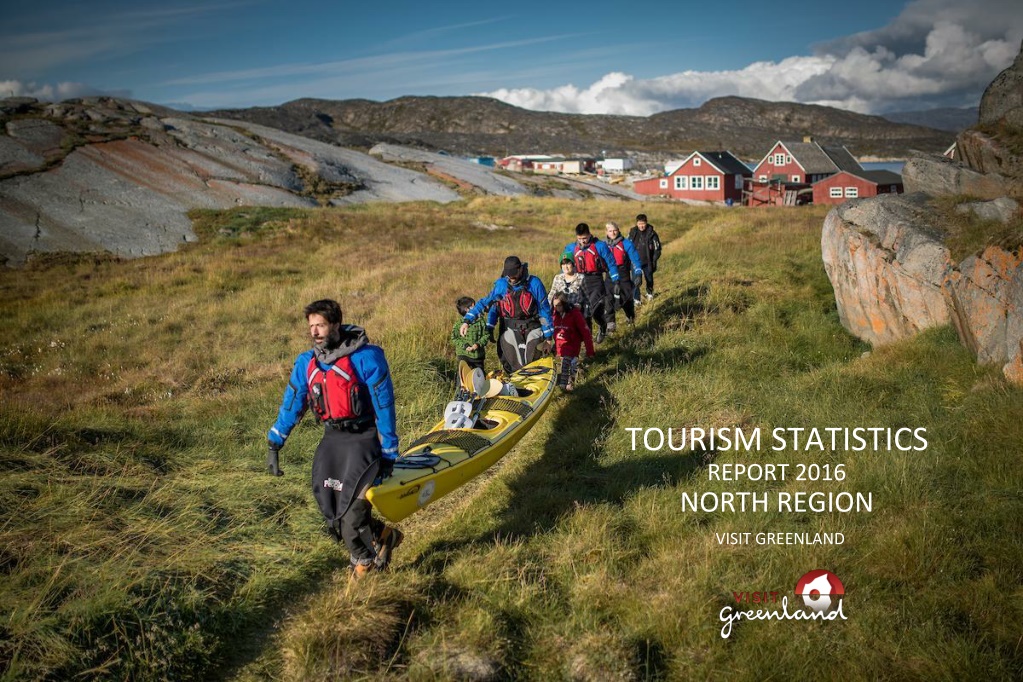
Tourism Statistics Report 2016: North Region Visit Greenland
In Q1 of 2015, Visit Greenland initiated its first regional tourism report focusing on flight passengers, overnight stays, and cruises. The report highlights the challenges in interpreting data accurately due to most tourists traveling via Kangerlussuaq. It emphasizes the importance of regional collaborations to improve insights into tourism revenue and overnight stays. The report will now be produced annually with regional updates throughout the year.

Download Presentation

Please find below an Image/Link to download the presentation.
The content on the website is provided AS IS for your information and personal use only. It may not be sold, licensed, or shared on other websites without obtaining consent from the author. Download presentation by click this link. If you encounter any issues during the download, it is possible that the publisher has removed the file from their server.
E N D
Presentation Transcript
TOURISM STATISTICS REPORT 2016 NORTH REGION VISIT GREENLAND
INTRODUCTION In Q1 of 2015 Visit Greenland made its first regional tourism report based on data on flight passengers, overnight stays in accommodations as well as cruises. Since then, VG has been working intensively with the data and has learned that some data can easily be over-interpreted. Data on the number of tourists directly by plane from Greenland, via regional airports, does not necessarily say so much about the number of tourists who have visited the region, as the vast majority of tourists from Greenland still travel via Kangerlussuaq. Data from Mittarfeqarfiit show that 85-90% of all passengers (incl. Greenlandic citizens) are travelling out of Ilulissat, Nuuk and the other larger cities via Kangerlussuaq. In other words, only 10-15 % of passengers travel out of the country directly via the Iceland routes from the cities. Tourists comprised a total of 64 % of all flight passengers in 2016. This report will focus more closely on the regional overnight stay statistics even though in its current form it does not cover all accommodations. On the other hand, Visit Greenland has initiated an intensive cooperation with the Arctic Circle region as the first region to arrive at a more accurate figure on the two parameters: Total tourism revenue and number of tourist stays (initially focusing on Kangerlussuaq). With the Arctic Circle cooperation as a pilot , Visit Greenland intends to roll out region specific collaborations in order to gain more knowledge of tourism generated revenue and overnight stays. Initially Visit Greenland intended to publish a tourism report quarterly. But our intensive work with tourism statistics over the last two years, have shown that the number of tourists in each quarter, except Q3, is so small that it does not provide valid useable data. Greenland still has so relatively few tourists that it is risky to interpret small fluctuations as they will appear unnaturally big as a percentage the less the number is. Therefore, going forward only one big national tourism report on the previous year will be produced. In Q1 this will be followed by regional reports such as this, but mainly as an addition to the national report as the most important results can be found there. Furthermore minor updates will be issued during the year via press releases and newsletters serving as a supplement to the annual main reports.
INTERNATIONAL FLIGHT PASSENGERS OUT OF ILULISSAT 2008-16 Ilulissat Airport has sent an increasing number of passengers in and out of the country and looking at the general development of the last 8 years it looks like a linear growth of an average of 483 more passengers per year. Until now we have seen a passenger mix that consists almost exclusively of tourists, and the greatest activity is duringthe summer season. During the winter season Air Iceland has two weekly flights, in June 5 weekly flights, and duringJuly-August 7 weekly flights. During the first year of the Ilulissat-Keflavik route Air Greenland has flown 2 weekly flights in June-August, a total of 16 return flights. This summer Air Greenland will once again have 2 weekly flights in July-August. The vast majority of passengers out (and in) of Greenland from Ilulissat still fly via Kangerlussuaq. At present time we have no 2016 numbers on this, but 2015 saw a distribution of 3,386 pax directly to Iceland vs 16,160 pax via Kangerlussuaq. This means that only 17.3 % of all passengers flew out of Ilulissat via Iceland. From 2011-2015 the development in the number of passengers from Ilulissat-Kangerlussuaq is consistent with a linear growth of 1,428 pax per year on average. Air Greenland does not have data on how many of their passengers flying the Ilulissat-Kangerlussuaq route have booked directly out of the country vs those flying to other destinations in Greenland.
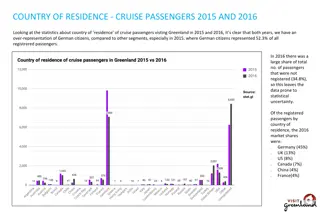
INTERNATIONAL FLIGHT PASSENGERS OUT OF ILULISSAT 2016 VS 2015 Of the total numberof flight passengers travelling out of Greenland, only 17.3 % travel via Ilulissat directly to Iceland. A fair share of the guests to Ilulissat and Qaasuitsup Municipalitytravel via Kastrup (Copenhagen Airport) and Kangerlussuaq. These are not included in the stat.gl data below. Please note: Through Air Iceland and Air Greenland we know that 216 saw an additional 803 passengers compared to what is stated in the stat.gl data below. This has not been confirmed by Statistics Greenland thus they are processed separately. The stat.gl data in the chart below shows a negative growth of -10.4 % in the tourist segment in 2016. However if we include the extra 803 passengers and assume that the mix of country of residence is the same as in the stat.gl data, it is the equivalent of a growth of 19.0 % in the tourist segment. There are less than 1,000 people from each country of residence, which gives a relatively high level of statistic uncertainty and means that the distribution percentage should be taken with reservations. As can be seen on the following page the scenario of the extra 803 passengers corresponds better with the trends as seen in the data on overnightstays.
NUMBER OF OVERNIGHT STAYS IN NORTH REGION The number of overnight stays in the accommodations in Qaasuitsoq is a good indicator of the tourism developmentin the region, even thougha number of smaller accommodations do not submit registrations. A total growth of 10.8 % and a growth in the tourist segment of 4.9% is indicative of a very positive development. The number of tourist overnightstays in Ilulissat alone in 2016 comprised of a staggering 33,256 out of the 38,420 in Qaasuitsoq, this is 86.6 % of the total number of tourist overnight stays in the region. Other cities in the Disko Bay have the advantage of only a few hours sailing distance to the tourist magnet Ilulissat. Uummannaq, Upernavik and Qaanaaq on the other hand are slightly more challenged by longer and more expensive travel for the tourists.
NUMBER OF GUESTS IN NORTH REGION The number of sold overnightstays is the best indicator on the developmentof tourism, but it also relevant to look at the number of tourists from differentmarkets. There has been a vast increase in the number of guests that the region has been able to attract in 2016. The region experienced an increase of 6 % in the numberof international guests in the accommodations in 2016. However the largest increase comes from the domestic market. The second largest growth in terms of number of guests comes from the Danish market. There were also indications of slowdown in the Danish market in the national air passenger data when comparing the Q3-4 2015 periods versus the same period in 2014, where there was zero growth. But there is now solid growth in the Danish market.
OCCUPANCY RATE IN ACCOMMODATIONS Visit Greenland regularly hears that the summer high season is often sold out early in the spring, both in terms of beds in accommodations and airline seats. It is therefore interesting what data on this is submitted by the accommodations. The charts below look at occupancy rates on accommodations in both the entire region as a whole and specifically in Ilulissat. As expected, the highest occupancy rates are seen in June-July- August-September. Looking at Ilulissat alone there is more activity than when we look at the region as a whole, and there is a fairly positive development from 2015 to 2016, both regionally and in Ilulissat. Especially for accommodations in Ilulissat, a positive development of the occupancy rate is seen in the spring shoulder season. Both charts also see positive growth, especially in the month of November.
CRUISE TOURISM PAX SIZE AND NUMBER OF CRUISES It is relevant to examine what size ships have had what number of cruises in Greenland during the last few years. Each cruise usually has between 2- 5 port calls per ship depending on the ship/product type. When we look at the trends nationallyover the past 8 years, the most significant development is the increase in the number of small expedition ships with passenger numbers below 250 pax. Whereas other pax categories see a relatively stabile numberof cruises from year to year, there is a vast increase within the category expedition ships since 2011. Though 2016 in fact saw 3.2 % fewer cruise passengers than in 2015, overall there is an increase in the numberof cruises. It is thus a number of cruises with fewer passengers on board the ships, but data in the chart on the previous page shows that there were more port calls per ship than the year before. As expedition ships passengers tend to be more active and engaged (often from segments such as Nature Lovers, Culture Lovers and Globetrotters rather than the less active Culture Appreciators, Nature Appreciators and Sightseers that often travel on the bigger ships) they are a better match with Greenland as they usually generate a bigger revenue per guest than other segments.
CRUISE TOURISM IN NORTH REGION With the national pattern from the chart on the previous page, it may be surprising that the developmentof Qaasuitsoq is reverse in terms of expedition ships. However, as mentioned before, variations become larger the smaller a destination is. And since this chart shows data for 2 years, it is too short a time perspective to be able to observe actual trends. When we look at the tourism development in Greenland with alternating negative and positive growth rates, one should always see it in view of the fact that there are still only fairly few tourists in Greenland. At a national level or over longer periods of time, it is easier to determine larger trends, as there is less statistical uncertainty here. In time Visit Greenland will get access to data from more years (e.g. registrations of the country of residence on flight passengers did not begin until Q3-14) and with an increasing numberof tourists from year to year the data will gradually be stronger. However, so far the regional data must be taken with reservations. When the chart shows a relatively large decrease in the number of expedition ships in Qaasuitsoq, it should be seen in a bigger perspective. On a national level there is a relatively significant increase in the number of cruises (the numberof cruises is not the same as the number of port calls in a region) for expedition ships, and this is a positive development as it is generally a more sustainable cruise tourism than the big ships. The most important factor in cruise tourism in Qaasuitsoq is how many times a tourist has had the opportunity to come ashore in the region, and this is shown in the chart on the next page.
CRUISE TOURISM IN NORTH REGION Though 2016 saw 3.2 % fewer cruise passengers in Greenland each ship had more port calls. Thus the guests have had the option to embark more times per guests than the year before as seen in the chart below. The 2015 cruise survey showed that 98 % of the guests come ashore at least once in Greenland. Due to the increased numberof port calls the guests have had the opportunityto come ashore more times than in 2015 this means that there have likely been more guests ashore in total. It is when the guests go ashore that they have the possibility to spend money in Greenland. If a cruise ship only sails by Greenland without a port call it does not pay cruise taxes (paid per port call or by gross tonnage) nor do the passengers buy any tourism products or any other merchandise/services. It is especially in the month of August that we see a significant growth compared with 2015. There may be large variations from year to year depending on schedule of the cruise lines, customer demand etc. so the slightly smaller fluctuations should be taken with appropriate reservations. It is worth noting that with effect from 2015 the Greenlandic Self-Governmentchanged the cruise taxes, so they are now paid per port call and by gross tonnage rather than per guest. This will save the shipping companies and hopefully in the long run lead to furthergrowth in the number of port calls in Greenland.
FINAL THOUGHTS Growth in the Ilulissat-Island Connections If we assume that there are 803 passenger registrations that have not been submitted to Statistics Greenland (stat.gl), as Air Iceland and Air Greenland have told us, this amounts to a 19 % growth in the tourist segment on the direct international routes out of Ilulissat. As mentioned we do not have passenger data on the tourists travelling via Kangerlussuaq to Qaasuitsoq. But the overnightstay data confirms that it is a healthy growth scenario. Overnight Stays As we only have flight passenger data on approximately 17 % of all passengers out of Ilulissat, the overnight stay data becomes our most important indicator on tourism development. A 4.9 % increase in the number of international overnight stays sold there is an overall growth even thoughnot all accommodations in Qaasuitsoq have submitted registrations. We have data from all the biggest overnight stays that make up approcimately 75 % of all overnightstay capacity. There is an increase of 6 % in the numberof international guests which means that each tourist bought slightly fewer overnights stays per tourist than in 2015. Seasonal Adjustment and Hotel Capacity A good use of the existing hotel capacity is crucial for a sustainable tourism industry and things are developing in a positive direction. The spring and autumn seasons are beginningto catch on compared with the traditionally hectic summer high season. It supports more full-year employment in the tourist industry and allows for better revenue for the hotels. The occupancy rates show that there is still a ways to go to reach a full occupancy rate, but we often hear from operators that there is a lack of beds during summer high season. Whether this is due to technicalities in terms of allotment and the like is difficult to say. But if the growth in tourism continues in the coming years an investment in more bed capacity, certainly in Ilulissat, is necessary. Cruises There were 18.7 % more passengers onboard cruise ships calling on Qaasuitsoq in 2016 compared with 2015. This has allowed for more guests to go ashore and buy tourist products, food, snacks, souvenirs etc. Though the small expdition ships only had 57 port calls vs 95 in 2015, in total more guests still visited Qaasuitsoq. In terms of the ship types Qaasuitsoq has seen the reverse trend than the rest of Greenland that in later years has seen a significant growth in the numberof cruises and port calls by expedition ships (less than 251 passengers). Qaasuitsoq did have one large ship with over 1,200 passengers in 2016. The reduced cruise taxes are meant as an incentive that will stimulate cruise tourism positively in the long run. The effects of this will most likely not be visible before a year or two from now, as this business operates with a long planning horizon. Compiled by Market Analysis Consultant Mads Lumholt, April 2017