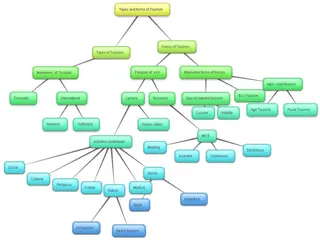
Compilation of Accommodation Statistics for Tourism Development

Compilation of accommodation statistics is crucial for understanding tourism supply, analyzing demand segments, and enhancing tourism development. This process involves identifying different types of accommodations, data collection, and classification of establishments to meet the diverse needs of tourists. Understanding the specifics of short-term accommodation services is essential for facilitating visitors' stays and supporting the overall tourism industry.
- Accommodation statistics
- Tourism development
- Data collection
- Tourism supply
- Short-term accommodations

Download Presentation

Please find below an Image/Link to download the presentation.
The content on the website is provided AS IS for your information and personal use only. It may not be sold, licensed, or shared on other websites without obtaining consent from the author. Download presentation by click this link. If you encounter any issues during the download, it is possible that the publisher has removed the file from their server.
E N D
Presentation Transcript
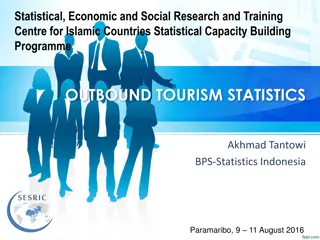
Statistical, Economic and Social Research and Training Centre for Islamic Countries Statistical Capacity Building Programme ACCOMMODATION STATISTICS Akhmad Tantowi BPS-Statistics Indonesia Paramaribo, 9 11 August 2016
Outline Background Compiling accommodation statistics Indonesia Accommodation Statistics
Background In order to attract visitors, goods and services must be available in the form and in the quantity that visitors might demand. Tourism supply is understood as the direct provision to visitors of the goods and services that make up tourism expenditure. The analysis of tourism supply consists: in showing how the conditions are created that enable producers to provide goods and services to visitors in describing the processes, the production costs and the economic performance of the suppliers in the tourism industries
Compiling accommodation satatistics To begin, it is important to determine the type of statistical unit for which information is sought and data compiled. In tourism, many producing entities operate on very small scale in a single location as unincorporated enterprises, family businesses or even as informal units of production, with only one establishment in activities such as food and beverage serving services, hotels and other personal services. Compilers should be particularly aware of the existence of these types of units, which might behave differently from the big formal units that often are the focus of statistical procedures and official registers.
Compiling (1) Because they spend a night outside their usual environment, tourists will need a specific place to stay overnight Short-term accommodation services are considered so important for tourism that many countries consider the establishments providing them The services provided on a commercial basis and the establishments providing them must be appropriately classified in order to obtain the information required for analysing different segments of demand and the producers servicing those segments which may vary in forms of organization, size and range of services offered.
Compiling (2) Data collection on accommodation services from the supply side offers the opportunity to cross-classify with information on the types of destinations where the accommodation establishments are located. There is already a long tradition of using non-monetary indicators collected from the supply side to monitor the capacities and use of the accommodation establishments and to depict the flows of both domestic and inbound tourism. It is an important source of information not only for the accommodation industry but also for tourism policy, administration and promotion.
Accommodation Survey For many countries, surveys of accommodation establishments are the most important short-term information source on supply as they are in general. To depict tourism flows, the number of arrivals and nights spent are the most used indicators. Nights spent are more appropriate to reflect the performance of the accommodation industry and the impact of the tourists stay for the place visited. Dividing the number of nights spent by the number of arrivals provides the average length of stay, which can be used as an analytical indicator to offer additional information on the kind of tourism in a country or region.
Data of Accommodation The following variables are most frequently used to describe the accommodation capacities: Months operating in the year; Number of rooms or accommodation units; Number of bed places; Occupancy rates by rooms or accommodation units (an indicator to be associated with revenue per room); Occupancy rates by bed places (an indicator to be associated with flows of visitors); Revenue per available room.
Indonesia Accommodation Statistics Statistics Indonesia (BPS) has conducted two surveys in collecting accommodation data: VHTS (monthly survey) VHTL (annual survey)
VHTS (Monthly Survey) Coverage: Throughout Indonesia territory : 34 provinces Star hotels : census Non star hotels : sample Some variables are collected in the survey: occupancy rates by rooms occupancy rates of bed places average length of stay number of guests (Indonesian and foreigner) Output: Press Release: star hotels, 27 provinces, monthly, occupancy rates by rooms and average length of stay Publication: all hotels and provinces, annually
Flow of VHTS Survey Census Entry E- mail Star Hotels BPS BPS VHTS Province BPS Regency/Mun Nonstar Hotels Sample
VHTL (Annual Survey) Coverage: all scale short-term accommodation establishment throughout Indonesia territory Some variables are collected in the survey: Number of accommodation establishments Number of rooms and room rates Number of workers by education level, job status and sex Hotel facilities Spending and revenue\ etc Output: Publication: annually
Flow of VHTL Survey Entry Star Hotels BPS BPS BPS Province Regency/Mun VHTL VHTL Nonstar Hotels
Annual Publications https://www.bps.go.id/index.php/Publikasi/
Figure 1. Number of Short-stay Acc Est by Clas, 2014-2015 18000 16156 15,488 16000 14000 12000 2014 10000 2015 8000 6000 4000 2197 1,996 2000 0 Star Hotels Others
Figure 2. Distribution of rooms of acc est by province, 2015 Jawa Barat, 11.94 Bali, 11.89 Others, 49.16 Jawa Timur, 9.78 DKI Jakarta, 9.40 Jawa Tengah, 8.38
Figure 3. Number of Workers of Acc Est by Education Level, 2015 121,049 Star Hotels 140000 Other Acc 120000 83,037 100000 50,104 80000 28,650 60000 23,056 8,498 9,424 9,251 40000 20000 0 Elem/Junior HS Senior HS Diplome Graduated
Figure 4. Occupancy Rate of Hotel Room in Star Hotels, 2013-2014 2013 59.76 55.38 2014 51.85 47.96 40.46 58.03 54.41 51.88 60 46.85 43.30 50 40 2014 30 20 2013 10 0 1 Star 2 Star 3 Star 4 Star 5 Star
Figure 5. Occupancy Rate of Hotel Room in Non Star Hotels, 2013-2014 2013 2014 41.62 36.55 31.59 30.92 39.53 50 37.70 34.73 34.35 40 2014 30 20 2013 10 0 < 10 10-24 25-40 > 40


")
")


")


")