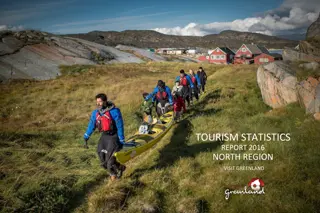
Regional Tourism Statistics Report 2016: Qeqqata Visit Greenland
In Q1 of 2015, Visit Greenland initiated regional tourism reporting focusing on flight passengers, overnight stays, and cruises. The report delves into the challenges of interpreting data accurately, especially regarding the number of tourists traveling via different routes. It highlights the importance of collaboration and accurate data collection in understanding tourism trends in Greenland. The report emphasizes a shift towards producing one comprehensive national tourism report annually, with supplementary regional updates. Key insights include the significance of Kangerlussuaq Airport as a hub for Greenland's air traffic and the gradual growth in tourist numbers.
Download Presentation

Please find below an Image/Link to download the presentation.
The content on the website is provided AS IS for your information and personal use only. It may not be sold, licensed, or shared on other websites without obtaining consent from the author. Download presentation by click this link. If you encounter any issues during the download, it is possible that the publisher has removed the file from their server.
E N D
Presentation Transcript
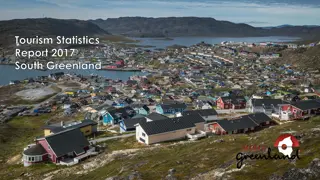
TOURISM STATISTICS REPORT 2016 QEQQATA VISIT GREENLAND
INTRODUCTION In Q1 of 2015 Visit Greenland made its first regional tourism report based on data on flight passengers, overnight stays in accommodations as well as cruises. Since then, VG has been working on a deeper level in the data and, among other things, has learned that some data can easily be over-interpreted. Data for the number of tourists directly by plane from Greenland, via regional airports, does not necessarily say so much about the number of tourists who have visited the region, as the vast majority of tourists from Greenland still travel via Kangerlussuaq. Data from Mittarfeqarfiit show that 85-90% of all passengers (incl. Greenlandic citizens) are travelling out of Ilulissat, Nuuk and the other larger cities via Kangerlussuaq. In other words, only 10-15 % of passengers travel out of the country directly via the Iceland-routes from the cities. Tourists comprised a total of 64 % of all flight passengers in 2016. This report will focus more closely on the regional overnight stay statistics even though in its current form it does not cover all accommodations. On the other hand, Visit Greenland has initiated an intensive cooperation with the Arctic Circle region as the first region to arrive at a more accurate figure on the two parameters: Total tourism turnover and number of tourist stays (initially focusing on Kangerlussuaq). With the Arctic Circle cooperation as a pilot , Visit Greenland intends to roll out region specific collaborations in order to gain more knowledge of tourism generated revenue and overnight stays. Initially Visit Greenland intended to publish a tourism report quarterly. But our intensive work with tourism statistics over the last two years, have shown that the number of tourists in each quarter, except Q3, is so small that it does not provide valid useable data. Greenland still has so relatively few tourists that it is risky to interpret small fluctuations as they will appear unnaturally big as a percentage the less the number is. Therefore, going forward only one big national tourism report on the previous year will be produced. In Q1 this will be followed by regional reports such as this, but mainly as an addition to the national report as the most important results can be found there. Furthermore minor updates will be issued during the year via press releases and newsletters serving as a supplement to the annual main reports.
PASSENGERS OUT OF GREENLAND VIA KANGERLUSSUAQ Kangerlussuaq airport is the main gateway to Greenland, and is as such a hub for about three-quarters of all air traffic in and out of Greenland. Generally a large proportion of the passengers are in transit to and or from other destinations in Greenland. Unfortunately we do not have precise data on this, but it's fair to assume that around three-quarters of the passengers are in transit. Even though we do not have data on the distribution of tourists before July 2014, the total number of passengers throughout the past 8 years, will give at least some indication about the development in the Greenlandic tourism industry overall. What we have is data on the share and distribution of tourists since Q3-14, and here one can observe a growth from Q3-4 2014 to Q3-4 2015 of 23,5%, and a growth from 2015 to 2016 (calendar years) of 13,1%. Source: stat.gl
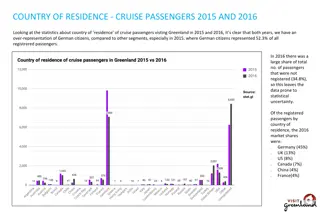
PASSENGERS OUT OF GREENLAND VIA KANGERLUSSUAQ Kangerlussuaq Airport is the only airport in the region with a direct flight out of Greenland (to/from Copenhagen and Keflavik). As mentioned in the introduction most travelers coming throughKangerlussuaq are in transit from other regions, and therefore one cannot look only at this traffic if one wishes to asses the development of the tourism in the region. Never the less the development in the numberof tourists by airplane does speak to the potential of feeding tourists furtherinto the Arctic Circle Region or offering transit tourist tours and other tourist products in Kangerlussuaq. An impressive growth of 13.1% can be observed in the number of tourists travelling out of Kangerlussuaq in 2016. Of the primary markets Germany, France and Great Britain have the highest growth. Please note: Countries with less than 1,000 pax are too small entities to show any clear trends and thus they are picturedin gray.
NUMBER OF OVERNIGHT STAYS IN ARCTIC CIRCLE REGION Examining the number of overnightstays registered and reported to Statistics Greenland, one can see a negative growth in tourists of -4.8 %, which seems in immediate opposition to the growth of 13.1 % in the numberof tourists travelling out of Kangerlussuaq Airport. But as previously mentioned these two numbers need not be coherent as the large majority of tourists by plane via Kangerlussuaq are in transit from other destinations. Since Q1 2017 Visit Greenland has collaborated with the Qeqqata Municipalityand Business Council in order to reach a more complete set of data on overnight stays as not all accommodations in the region reports to Statistics Greenland. First off we have decided to focus solely on Kangerlussuaq, as Qeqqata has asked VG for help verifyingtwo importantnumbers: The total tourism turnovergenerated by Kangerlussuaq as a tourist destination as well as the number of tourist overnight stays sold in 2016. The following pages will deal with this.
NUMBER OF OVERNIGHT STAYS IN KANGERLUSSUAQ Looking more closely at the data from Statistics Greenland (green fields) and the new data collected in cooporation with Qeqqata Business Council (blue fields) the number of tourist overnight stays in Kangerlussuaq in 2016 reaches 27,447. In Kangerlussuaq alone 10,179 more tourist overnight stays (however without specifications of country of residence), and in Sisimiut an additional 1,700 tourist overnight stays were found. The newly registered tourist overnightstays in Kangerlussuaq includes data from Hotel Umimmak, Building 664 (both leased to international ice scientists), Kangerlussuaq Youth Hostel as well as smaller accommodations and camps. Through thoroughresearch 59 % more tourist overnight stays have been foundin Kangerlussuaq. If we are to obtain the same complete sets of data for other destinations like Nuuk and Ilulissat it requires a close collaboration with the municipalities in question and this is an objective for Visit Greenland in the coming years.
TOTAL TOURISM REVENUE IN KANGERLUSSUAQ At the core of the collaboration with the Qeqqata Business Council was to find establish total t ourist revenue that destination Kangerlussuaq contributes to the Greenlandic economy. Visit Greenland and the Qeqqata Business Council established contact with almost all tourist operators and were able to get 2016 tourism revenue number from practically everybody which was very positive. The tourist revenue includes trips, overnight stays, meals, souvenirs as well as other services products/merchandise sold to tourists. It also includes airfare in package deals with Kangerlussuaq as the primary destination and additionally airport taxes on these airfares. Not included are airplane tickets that might have had Kangerlussuaq as the only or primary destination (incl. airport taxes), but that have not been verified at the time of publication of this report. The total tourism revenue in 2016 is at least an estimated 71 million DKK. Total Tourism Revenue in Greenland In comparision the total tourism revenue in all of Greenland in 2015 was estimated at 472 million DKK. Statistics Greenland settled on this number on the basis of information on the average daily consumption of the tourists (food/drinks, entertainment, gifts/shopping and transportation during the stay in Greenland) from a survey in 2009 (projected with 1.7 % per year) plus overnight stay revenue and the average amount spent by cruise guests per port call. More Than a Transit Airport Today the role of Kangerlussuaq is more than just the place of an international transit airport for all of Greenland. It has developed into one of the biggest tourist attractions of Greenland not far in size from Ilulissat and Nuuk. If the destination is to be developed further in the form of new investments it requires a clarification about the status of the airport in the long term.
NO. OF GUESTS IN ACOMMODATIONS IN ARCTIC CIRCLE REGION The data below from StatisticsGreenland is on the number of guests in accommodationsin Qeqqata. The actual number is most likely a lot higher, as we studied overnightstaysin Kangerlussuaq and establishedthatthere had been 59 % more touristovernight staysthan the 17,268 thathad been registered. This number is for the most part attributedto Hotel Umimmak, Building 664 and Kangerlussuaq Youth Hostelthat have not submittedregistrationsto StatisticsGreenland. These three accommodationsalone have had a combinedtotal of approximately 9,000 touristovernight staysin 2016. Registration of overnighttourists poses a bit of a challenge, if one wants all accommodations, even the smallest, to be a part of the registration program. Next step in the collaboration with the Qeqqata Business Council is to contact all accommodations in the region that have not submitted registrations in the past.
OCCUPANCY RATE IN ACCOMMODATIONS IN ARCTIC CIRCLE REGION We have highlighted the years around 2008 as the previous growth period, before the effects of the global financial crisis set in and resulted in a negative growth in the period through2014. The chart below indicates that 2016 is the best year so far when it comes to the occupancy rate in overnightaccommodations in the region. As can been seen in the chart on page 4 2016 saw a 4.8 % decrease in the number of tourist overnight stays, but on the other hand a 16.5 % growth in the number of resident overnightstays. In 2015 the Greenlandic segment made up 46 % of all overnightstays, but in 2016 they made up 51 % of all overnight stays in Qeqqata. This indicates that the accommodations in Qeqqata (with an overall 5.2 % growth in the number of nights in total) have succeeded in attracting far more guests from the home market, probablyin connection with conferences, meetings and the like. This makes sense if one looks at the central position of the region compared with the other regions in Greenland that it is easier to gather operators from all regions in the middle of Greenland . So far, there is no critical pressure on the capacity during the summer high season, such as in Ilulissat, so there is room for growth in the tourism segment throughoutthe year.
CRUISE TOURISM IN ARCTIC CIRCLE REGION Kangerlussuaq Airport serves as an exchange port for a number of cruise ships in Greenland. Very few exchanges take place in Nuuk, Narsarsuaq, Aasiaat or Ilulissat. Overall there were 3.2 % fewer cruise guests in Greenland in 2016 than in 2015. However each on average ship called on more ports than in 2015, so in actuality the destinations in Greenland welcomed more passengers in 2016 than in 2015. This enables greater revenue from sales of tours, souvenirs and other products/services. In total 2016 saw 6.5 % more passengers onboard ships calling on ports in Qeqqata than in 2015. The primary growth has been in August and September, so even though July saw a negative growth of -24 %, the combined growth in August- September was still bigger. In spite of the fact that far most calls in Kangerlussuaq primarily are due to exchanges of guests via airplane, operators in Kangerlussuaq report that they still sell many tours and merchandise to cruise guests as they often have an outing in Kangerlussuaq included in their itinirary.
CRUISE TOURISM PAX SIZE AND NUMBER OF PORT CALLS On the previous page we examined how many cruise passengers were onboard cruise ships calling on cities in Qeqqata per month in 2015 and 2016. Below is a list of ship types to call on ports in Qeqqata i 2015 og 2016. They are divided into 4 categories depending on how many guests they can accommodate. It is normal for the number to vary from year to year, and fluctuations might be labelled natural variations especially in the case of destinations with a small tourist volume. It is primarilyworth noting which type of ship size is likely to visit the region. Almost none of the biggest ships visit the region. Comparing with the following page s number of cruises done nationally by the same four ship types, it says something about the potential to attract more of one kind or another ship. It remains open which ship types the region is interested in attracting. It may be that the current mix is preferred. The next page highlights the small 1-250 pax category as there is an interesting developmentto follow on a national level.
CRUISE TOURISM PAX SIZE AND NUMBER OF CRUISES It is relevant to look at what ship sizes have had what numberof cruises in Greenland over the last few years. Each cruise typically has anywhere from 2-5 port calls in cities per ship depending on the ship and or product type. Nationally over the last 8 years the most significant developmentcan be seen in the growth in the numberof the small, so-called expedition ships with passenger numbers under 250 pax. Whereas the other pax categories have a relatively stable amount of cruises from year to year, the expedition ships have seen a significant growth since 2011. Though 2016 saw 3.2 % less cruise tourists compared with 2015, overall there is an increase in the numberof cruises. This means that the ships carried fewer passengers, but the chart on the previous page shows that each ship had more port calls per cruise than the year before. As expedition ships generally carry more active passengers (often from the segments Nature Lovers, CultureLovers and Globetrotter rather than the less adventurous Culture Appreciators, Nature Appreciators and Sightseers that often travel on the larger ships) they are a better match with Greenland as they are more sustainable and generate more revenue per guest than other segments.
FINAL THOUGHTS Kangerlussuaq Is a Bigger Destination than Previously Assumed The most interesting result of the study of the tourism data in cooperation with the Qeqqata Business Council is that Kangerlussuaq proves to be a significantly larger destination, than the previous available overnightstay data indicated. It will be very interesting to extend the collaboration to include the entire Qeqqata Region in the remainder of 2017. Lack of Data on Transit Tourists via Airplane As mentioned Visit Greenland has not yet been able to differentiate according to pax registration carried out in Kangerlussuaq Airport on passengers out of Greenland. With Mittarfeqarfiit as a source we know that 80-90 % of all travelers out of the biggest cities of Greenland still use Kangerlussuaq as a hub compared to travelling directly out of the regional airport via Iceland. Air Greenland has some of these data in its system, but it is as of yet able to distract them as it takes a lot of adaptation. Next year we will hopefully be one step closer to describing how many of them are travelling throughKangerlussuaq Airport that are on their way out of the country from which destinations. But other methods are also being considered such as questionnaire surveys in Kangerlussuaq Airport. Overnight Stay Capacity The data on page 8 clearly shows that the hotels have more room for tourists throughout the season. On the other hand, the hotels have been good at attracting more resident guests. However from a national economic perspective the foreign visitors present a bigger value in currency. The chart also shows that over the past years the seasons have increasingly levelled which is a really positive foundation for a sustainable economy for the accommodations including the opportunity to hire full-yearstaff. Cruise 6.5 % more passengers aboard ships calling on ports in Qeqqata in 2016 compared to 2015 constitutes a positive development. The deciding factor is not how many guests are onboard ships in the Greenlandic waters, but rather how many ports are called upon as this is when the tourists have the opportunityto go ashore thus making the sale of tourism related products, commodities and services possible. Need for a Clarification about the Kangerlussuaq Airport In order for Kangerlussuaq to develop further as a tourist destination a clarification about the role of the airport is needed. In this context it is positive that the collaboration with the Qeqqata Business Council and the Qeqqata Municipality has providedthe decision makers with more thoroughand recently updated data. Compiledby market analysisconsultantMads Lumholt, April 2017
