Tourism Statistics Report 2017 - South Greenland Overview

The Tourism Statistics Report 2017 for South Greenland highlights positive growth in overnight stays and cruise passengers. Despite incomplete flight passenger data, the report indicates a promising trend for tourism in Greenland. Challenges such as accessibility and capacity remain, but overall optimism for future growth is expressed. The report also discusses flight passengers traveling out of Greenland via Narsarsuaq Airport and emphasizes the need for complete data registration to accurately analyze tourism trends.

Download Presentation

Please find below an Image/Link to download the presentation.
The content on the website is provided AS IS for your information and personal use only. It may not be sold, licensed, or shared on other websites without obtaining consent from the author. Download presentation by click this link. If you encounter any issues during the download, it is possible that the publisher has removed the file from their server.
E N D
Presentation Transcript
Tourism Statistics Report 2017 South Greenland
Introduction As explained in the national tourism statistics report 2017 the flight passenger data from 2017 unfortunately cannot be used to identify trends in the Greenlandic tourism development as it is not complete. Visit Greenland, Statistics Greenland and Mittarfeqarfiit have joined forces to ensure a more complete registration in 2018. Thus this regional report primarily focuses on the overnight stay statistics and the cruise statistics. We recommend that this report is seen as a supplement to the national report as that is based on a larger data volume minimizing the statistical uncertainty. Furthermore the national report looks in depth at the latest tourism interviews conducted by two Visit Greenland interns from the tourism program at Aalborg University during July and August 2017. The tourist overnight stay statistics, the cruise statistics as well as feedback from Greenlandic tourism operators show that overall 2017 was a good year for tourism in Greenland. As the incomplete flight passenger data from this year could not be used we chose instead to ask 240 Greenlandic tourism operators about their 2017 season and their expectations for 2018. We received answers from a total of 82. The numbers on overnight stays show an overall growth of approximately 10% while the number of cruise passengers has increased by 13.1%. Only 5.5% of the tourism operators reported negative growth while the rest either had a season similar to 2016 or experienced growth. Globally 2017 has been one of the best years in recent times with a total growth of 7% with Europe as a region experienced a growth of 8%. The prognosis on the coming years points to a continued medium-high global growth of approximately 5%. Iceland is still a part of the growth elite and in 2017 the country experienced a growth in the number of international passengers of 24.2%. It is expected that during 2018 more than 10 million passengers will pass through Keflavik. Despite the fact that Air Iceland Connect report a negative growth of -9.7% on routes between Iceland and Greenland from 2016 to 2017 the potential for Iceland-Greenland combination trips is still relevant to consider also by virtue of the feedback from many of the 292 land based tourists interviewed by Visit Greenland in July-August (please, see the national tourism report p. 28). Each region undeniably still has its challenges whether it d be accessibility, over- or under-capacity in the high season, logistics and the like. However since 2014 there has been a relatively nice growth nationally and overall there is reason for continued optimism when it comes to the next few years.
Flight Passengers Travelling Out of Greenland via Narsarsuaq Airport As mentioned in the introduction the registration of passenger country of residence in 2017 is incomplete. With 12.1% non-registered Narsarsuaq Airport has been affected to a medium extent, but as mentioned in the introduction we aim to secure a more complete registration in 2018. The growth percentage for country segments with less than 1,000 passengers is listed in grey as even a difference of a few passengers from year to year can cause an exaggerated fluctuation in the growth percentage and should thus be taken with reservations. Other reservations to be taken into account: Most tourists still travel to and from the region via Kangerlussuaq and not directly between Narsarsuaq and Reykjavik or Narsarsuaq and Copenhagen as those routes are only active during the summer. The graph on the left only shows passengers on direct flights out of Greenland and only includes the previously mentioned summer routes. Due to the reservations stated above Visit Greenland recommends that the numbers from the graph on the left should not be used to identify trends in the tourism development in South Greenland. For this specific purpose the overnight stay statistics is a more credible source.
Number of Overnight Stays in the Region A growth of 154.6% in the number of international overnight stays (per definition tourists) points in an entirely different direction than the flight passenger numbers. We do know that data from 7 smaller accommodations that did not submit registrations prior to 2017 were included in the registrations in 2017. that is the equivalent of 3,263 international overnight stays. In order to determine a real growth rate in the number of tourist overnight stays we must deduct these from the 2017 numbers. This corresponds to a growth of 81.7% which is unlikely high. Thus it cannot be ruled out that a number of errors have happened in the registration. An alternative explanation is that tourists in 2017 to a greater extent bought overnight stays in 2017 vs 2016 instead of sleeping in private homes or in open air (in tents or camps). When one looks at which tourist segments that has the largest growth (in raw numbers and not growth percentage) Denmark takes the lead with 2,253 more overnight stays which is the equivalent of a growth of 79%. Followed by other Europe with 1,735 overnight stays which is the equivalent of 606,6%. Other countries stands for 994 more overnight stays which is the equivalent of a growth of 558.4%. The rest of the country segments are so far below 1,000 overnight stays that the statistical uncertainty is so large that these data cannot be used to identify credible trends.
Number of Individual Guests in the Region In order to make a real comparison between 2016 and 2017 the data from the 7 recently added accommodations in the statistics database must be deducted. Combined they had a total of 1,757 international guests (tourists). When they are deducted the growth in the number of individual international guests comes to 50.4%. Again this is a growth so high that a certain amount of errors in the registrations cannot be ruled out. In absolute terms that corresponds to a total of 1,074 more international guests in the accommodations in the region in 2017 and that is very positive. When a region such as South Greenland represents a relatively small number of tourists a difference of only a few tourists from one year to the next can cause a significant change in percentage. In order to identify any real trends one should look at a longer period of time: Even when one takes into account the data from accommodations that did not submit registrations until 2017 the growth in the tourist segment from 2016 to 2017 looks very high. It will be easier to assess when the data on 2018 is available.
Occupancy Rates in Accommodations in the Region In general the pattern of the occupancy rate over the 12 months of the year the typical shape is practically pyramid shaped so that the winter months have a low occupancy rate that then increases toward summer culminating in July. The pattern of occupancy rates for accommodations in South Greenland in 2017 does not quite follow this general trend as it has a couple kinks along the way. The most surprising is a steep increase in May followed by a decrease in June, and July has a smaller occupancy rate than May (please see the graph to the left). The occupancy rates however automatically include Greenlandic citizens. In order to clarify this issue further we have to look at the number of overnight stays bought by Greenlandic citizens vs tourists over the 12 months of 2017 (as seen in the graph to the right). To a larger extent the pattern of the tourist segment looks like the traditional pyramid shape, however there is still a decrease in June. Overall there is a capacity surplus in accommodations in the region in all months especially the winter months. Objectively speaking that represents a potential for season expansion and special overnight stay promotions could be considered in the low season.
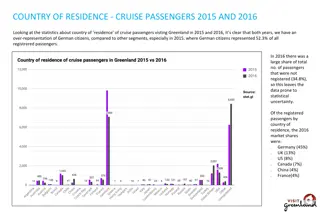
Number of Cruise Passengers in the Region 2017 vs 2016 Left graph: Generally a non-satisfactory picture with only negative growth rates. Overall this corresponds to a total negative growth in the region of -32.8% or the equivalent of 7,458 fewer cruise passengers on ships at port calls in cities in 2017 compared to 2016. We know that one of the larger cruise lines that used to operate in the region bowed out in 2017. This may be just a coincidence, a sign of a less demand in the southern region or a something entirely third. Since the number of passengers on cruise ships visiting Greenland in 2017 was 13.1% higher than in 2016 the decline in demand is not indicative of the demand on Greenland as such. The reasons for this relatively large decline in South Greenland must be regarded as undecided. Right graph: It is, however, useful to look at a longer period of time in order to get a sense of long term trends. Since 2014 there has been a general growth tendency (please see the moving average line on the graph) and that is positive for Greenland as a whole. Unfortunately, we do not have consistent data on South Greenland in the same period available as the registration and type of data changed in 2015.
Number of Port Calls in the Region According to Passenger Capacity 2015-2017 The graph to the left shows the number of port calls of ships in the region according to the 4 pax (passenger capacity) categories 0-250, 251-500, 501-1200 and 1200+ pax, it is clear that the biggest fluctuations can be found in the two smallest pax categories. For 0-250 pax category there is a decrease of 9 port calls from 2016 to 2017 For the second smallest category, 251-500 pax, there is a gradual decline from 14 to 12 port calls For the second largest category, 501-1200 pax, there has been a gradual growth in the number of port calls from 13 to 28 in the 3-year period which is positive In the largest category, 1200+ pax, over the 3 years there is only a jump of 2 port calls in 2016, ending on the same level as in 2015 The graph to the right shows the number of cruises in all of Greenland over a longer period of time. It is clear that the biggest fluctuations are found in the smallest pax category. The number of port calls and the number of cruises are not the same as a cruise covers a number of port calls (typically from 3 to 6) before the passengers are exchanged. Unfortunately, we do not have a consistent data neither for the number of port calls or number of cruises in South Greenland as the registration and type of data collected were changed in 2015.
Final Thoughts As previously mentioned the flight passenger data cannot be used to identify trends in the tourism development in the region, especially not in a year with incomplete registrations and because the data from Narsarsuaq Airport only includes passengers travelling out of the region on direct connections to either Copenhagen or Reykjavik which only cover the summer months and do not include tourist-influx via Kangerlussuaq or Nuuk. A growth in the number of tourist overnight stays of a staggering 81.7% even after the deduction of the newly added accommodations from 2017 in the database sounds almost too good to be true and as previously stated one must take into account possible misregistrations. If on the other hand everything has been registered correctly 2017 will have been a very good year for accommodations in the region og thus also a very good year for the tourism. Cruise data however paints a fairly negative picture. We know that one larger cruise line that used to opoerate in the region bowed out in 2017, but we do not know the reason why. It is very possible that 2017 represents a temporary fluctuation in a negative direction, as we see growth on a national level. As a supplement to the regional report next year we will interview relevant operators to better understand the dynamics. A short addition to cruise port calls: If an artisan or souvenir salesman would like to make it easy for cruise guests to pay with credit card one can rent a small mobile creditcard terminal at nets.dk for circa 350 DKK/month and pay circa 115 DKK/month in a fixed fee for transactions with international credit cards. Please, write lumholt@visitgreenland.com for more information. Thus both positive and negative indicators can be seen in the southern region. As mentioned it is always easier to identify trends based on a longer period of time than just from year to year. Registration of the country of residence of the flight passengers began in July 2014 and new formats of data on cruises were introduced in 2015. Therefore in time it will be gradually easier to decode the development as our database grows. Finally we only have left to wish everyone a successful 2018 tourism season. We look forward to a mutally beneficial collaboration. Best regards Visit Greenland Compiled by Market Analysis Consultant Mads Lumholt, April 2018