Interactive Change Point Analysis Dashboard in JMP by Ademola Akande
Explore the iterative JSL automation function for detecting change points in processes. Significance levels impact the identification of change points, enhancing decision-making in manufacturing line performance monitoring. Historical data analysis and conjunction with control charts improve interpretation. This method, integrated into routine monitoring, streamlines analysis and quantifies change validity, although outliers' influence remains unexplored. Illustrative examples like UK annual rainfall depict the methodology's effectiveness.

Download Presentation

Please find below an Image/Link to download the presentation.
The content on the website is provided AS IS for your information and personal use only. It may not be sold, licensed, or shared on other websites without obtaining consent from the author.If you encounter any issues during the download, it is possible that the publisher has removed the file from their server.
You are allowed to download the files provided on this website for personal or commercial use, subject to the condition that they are used lawfully. All files are the property of their respective owners.
The content on the website is provided AS IS for your information and personal use only. It may not be sold, licensed, or shared on other websites without obtaining consent from the author.
E N D
Presentation Transcript
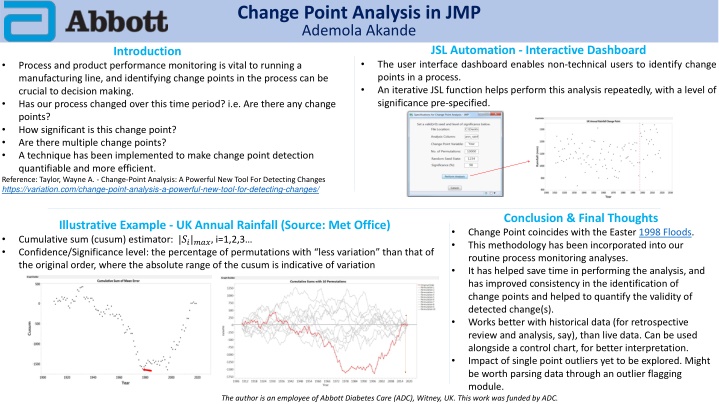
Change Point Analysis in JMP Ademola Akande JSL Automation - Interactive Dashboard The user interface dashboard enables non-technical users to identify change points in a process. An iterative JSL function helps perform this analysis repeatedly, with a level of significance pre-specified. Introduction Process and product performance monitoring is vital to running a manufacturing line, and identifying change points in the process can be crucial to decision making. Has our process changed over this time period? i.e. Are there any change points? How significant is this change point? Are there multiple change points? A technique has been implemented to make change point detection quantifiable and more efficient. Reference: Taylor, Wayne A. - Change-Point Analysis: A Powerful New Tool For Detecting Changes https://variation.com/change-point-analysis-a-powerful-new-tool-for-detecting-changes/ Conclusion & Final Thoughts Change Point coincides with the Easter 1998 Floods. This methodology has been incorporated into our routine process monitoring analyses. It has helped save time in performing the analysis, and has improved consistency in the identification of change points and helped to quantify the validity of detected change(s). Works better with historical data (for retrospective review and analysis, say), than live data. Can be used alongside a control chart, for better interpretation. Impact of single point outliers yet to be explored. Might be worth parsing data through an outlier flagging module. Illustrative Example - UK Annual Rainfall (Source: Met Office) Cumulative sum (cusum) estimator: |??|???, i=1,2,3 Confidence/Significance level: the percentage of permutations with less variation than that of the original order, where the absolute range of the cusum is indicative of variation The author is an employee of Abbott Diabetes Care (ADC), Witney, UK. This work was funded by ADC.
Change Point Analysis in JMP Ademola Akande Significance Level Impact on Change Points Detected 98% Significance 76% Significance 49% Significance 1% Significance Invalid!
Change Point Analysis in JMP Ademola Akande How significant is the change point? Significance level: the percentage of permutations with less variation than that of the original order; Where variation is measured as the absolute range of the cusum.
Change Point Analysis in JMP Ademola Akande https://www.metoffice.gov.uk/climate/uk/interesting Heavy rainfall/strong winds - 14/15 October 2002 14 - 15 October100% Heavy rain fell over much of southern and eastern England... October 2001 rain 20 October The Bracknell Storm - 7 May 2000 7 May Hot spell August 1990 August Easter 1998 floods Record December 2001 sunshine December April 2000 - Record rainfall April Heavy rainfall/strong winds - 13 October 2002 13 October Heavy rainfall and Strong winds occurred over much of the south-west of the UK... Burns' Day Storm - 25 January 1990 25 January February 2001 9 February The wet autumn of 2000 Autumn Heavy rainfall - East UK 20/21 October 2001 21 October Record rainfall - October/December 2002 October - December Heavy rain during October to December 2002... 1990 1998 2000 2001 2002