Don’t Implement a BI Dashboard Tool Without Understanding These Key Performance Metrics
Explore the crucial metrics essential for maximizing the effectiveness of BI dashboard tools in our latest blog. Before you implement a BI dashboard, discover which performance indicators are vital to understand, ensuring that your data works as hard
Download Presentation

Please find below an Image/Link to download the presentation.
The content on the website is provided AS IS for your information and personal use only. It may not be sold, licensed, or shared on other websites without obtaining consent from the author. If you encounter any issues during the download, it is possible that the publisher has removed the file from their server.
You are allowed to download the files provided on this website for personal or commercial use, subject to the condition that they are used lawfully. All files are the property of their respective owners.
The content on the website is provided AS IS for your information and personal use only. It may not be sold, licensed, or shared on other websites without obtaining consent from the author.
E N D
Presentation Transcript
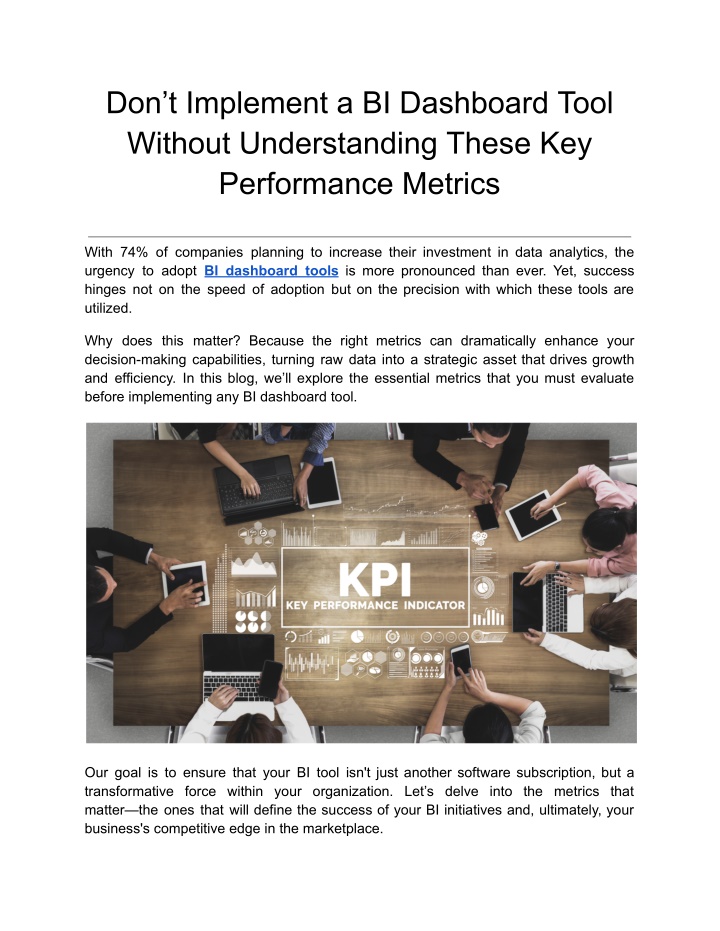
Dont Implement a BI Dashboard Tool Without Understanding These Key Performance Metrics With 74% of companies planning to increase their investment in data analytics, the urgency to adopt BI dashboard tools is more pronounced than ever. Yet, success hinges not on the speed of adoption but on the precision with which these tools are utilized. Why does this matter? Because the right metrics can dramatically enhance your decision-making capabilities, turning raw data into a strategic asset that drives growth and efficiency. In this blog, we ll explore the essential metrics that you must evaluate before implementing any BI dashboard tool. Our goal is to ensure that your BI tool isn't just another software subscription, but a transformative force within your organization. Let s delve into the metrics that matter the ones that will define the success of your BI initiatives and, ultimately, your business's competitive edge in the marketplace.
Critical Metrics for Evaluating BI Dashboard Tools Before Implementation Implementing a BI dashboard tool involves more than just setting it up; it requires an understanding of the specific metrics that can determine its success or failure. This deeper dive into the critical metrics incorporates advanced technicalities and BI-specific information to ensure that your BI dashboard software not only functions efficiently but also aligns perfectly with your strategic objectives. 1. User Engagement Metrics Understanding user engagement with your BI dashboard tool is very important. Metrics such as active users, session duration, and frequency of use provide insights into how integral the tool is becoming in the daily workflow of your team. For instance, a high number of active users and extended session durations typically indicate that the dashboard is delivering value, prompting users to rely on it regularly. These metrics help you gauge the dashboard's usability and intuitiveness key factors in sustained adoption. To gauge the effectiveness of your BI dashboard tool, detailed user engagement metrics need to be considered: Active Users: This metric tracks the number of distinct users who interact with the dashboard within a given timeframe. High activity levels are indicative of a tool that's considered essential by its users. Session Duration: Measures the average time users spend on the dashboard per session. Longer durations often imply that users find the dashboard useful for their analytical needs. User Interaction Events: Advanced tracking of interactions, such as a number of reports generated, filters used, or custom views saved, can indicate how deeply users are engaging with the tool. These metrics help identify not only the usability of the BI dashboard but also its integration into regular decision-making processes. 2. Data Quality Metrics The adage 'garbage in, garbage out' holds particularly true for any BI dashboard software. Data quality metrics are crucial as they directly influence the reliability of the insights generated. Key metrics include:
Accuracy: Are the data points correct and reflective of reality? Completeness: Does the data fully capture the required information without gaps? Timeliness: Is the data updated frequently enough to support real-time decision-making? Regular audits and feedback loops can help maintain high data quality, ensuring that your BI dashboard solutions are based on the most reliable and up-to-date information. You can ensure the integrity of your BI systems, where decision-making depends on the integrity of the data presented, in the following manner: Accuracy: Implement data validation rules and anomaly detection algorithms to ensure that the data reflects true and verified information. Completeness: Use completeness checks to verify that all expected data fields are populated and that missing data notifications are configured to alert users when data gaps are detected. Timeliness: Establish benchmarks for data freshness and set up real-time monitoring to ensure data is updated as frequently as business needs dictate. 3. Performance Efficiency Metrics The technical performance of your BI dashboard tools can significantly affect user satisfaction and overall productivity. Important metrics to track include: Load Time: How quickly does the dashboard populate data upon request? Real-Time Processing: Can the tool effectively handle streaming data to deliver up-to-date insights? These metrics are critical for businesses that rely on timely data to make quick decisions. You can ensure a BI tool s performance parity in the following ways- Load Time: Monitor backend performance to ensure data queries and visualizations load within acceptable time frames. Optimization may involve enhancing the data architecture or streamlining the data retrieval processes. Real-Time Processing: Employ streaming data technologies and in-memory analytics to facilitate real-time data processing, crucial for dynamic and fast-paced business environments. If a BI tool lags or fails to update promptly, it could lead to missed opportunities or flawed decision-making based on outdated information.
4. Adoption Rate Metrics Lastly, measuring the adoption rate of your BI dashboard tool provides insight into its overall success across the organization. This metric assesses how quickly and broadly the tool is being used after its introduction. A slow adoption rate could signal issues with user training, dashboard complexity, or a mismatch between the tool s capabilities and the users needs. Strategies to enhance adoption include comprehensive training sessions, regular updates based on user feedback, and executive endorsement to encourage utilization across all levels of the company. Understanding the adoption rate involves several layers of analysis: Initial Uptake: Measure how many users start using the tool within the first weeks of launch. Low uptake might indicate the need for more user training or adjustments to the dashboard s interface. Continued Usage: Track how usage trends develop over time. Are users continually engaging with the tool, or do they drop off after the initial phase? Departmental Penetration: Analyze adoption across different departments to identify which teams are leveraging the BI tool most effectively and which may require additional support. These metrics not only assess how quickly and extensively the BI dashboard tool is adopted but also highlight areas where further intervention may be required to increase its effectiveness across the organization. Conclusion As we've detailed, the careful evaluation of key performance metrics before deploying a BI dashboard tool is not just a step it's a strategic necessity. These metrics provide a compass that guides your BI initiative, ensuring it not only launches successfully but continues to deliver value long into the future. They empower your organization to leverage data with confidence, making informed decisions that propel your business forward. At Grow, we understand the importance of this foundational step and support our clients through every stage of their BI journey. We encourage you to explore how our BI dashboard solutions can transform your data into actionable insights with precision and ease. Experience the full capability of our platform with a 14-day free trial and see how other businesses are achieving remarkable success with Grow by checking out Grow Reviews 2024.
Don't let the potential of your data be hindered by unoptimized tools. Choose a BI solution that grows with you. Explore Grow today and step confidently into a data-driven future.

