Hand Calculation of Odds Ratio Using JMP Results


Calculate Odds Ratio by hand
using JMP results
Meichen Dong
12/16/2021

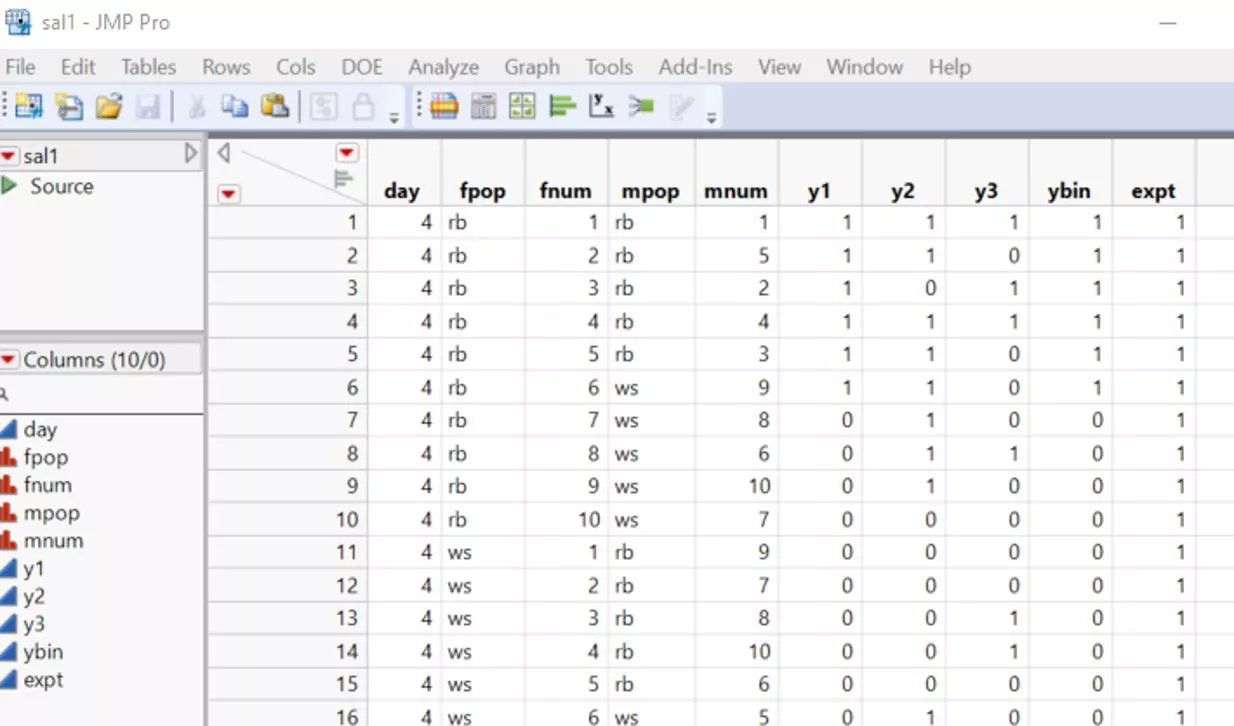
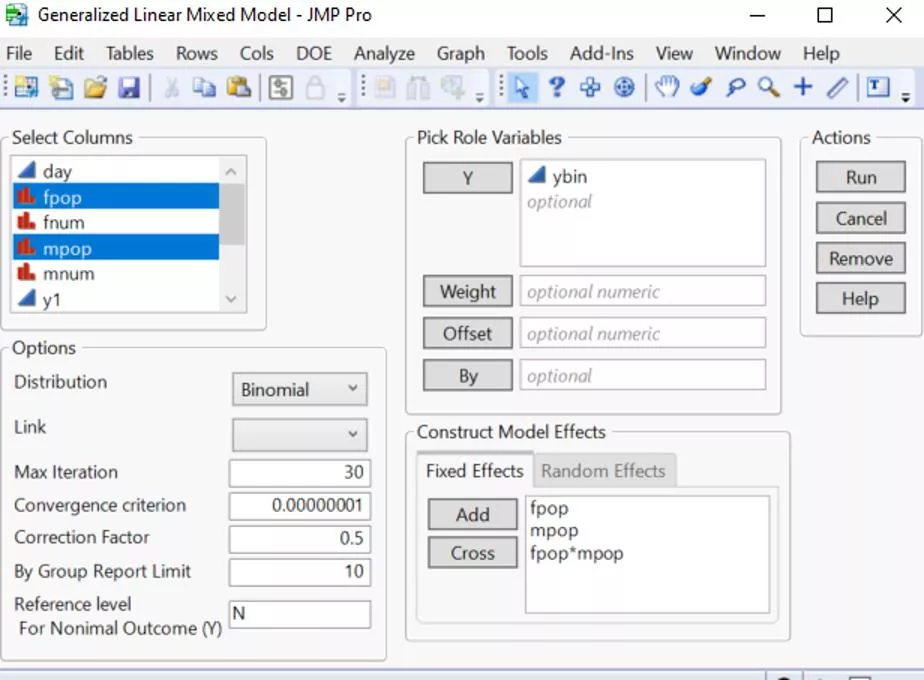
Example: sal1.jmp
Y: ybin
Fixed Effects: fpop, mpop, fpop*mpop
Random Effects: fpop*fnum, mpop*mnum
Right click on ‘Parameter Estimates’ table in the JMP report
Select “Make into data table”, and you will
derive a new table as below:
Using the parameter estimate table
Odds Ratio calculation example:
•
https://www.proteus.co.nz/news-tips-and-tricks/how-to-calculate-
odds-ratios-from-logistic-regression-coefficients/
•
This link provides a simple example of how to calculate OR by hand. I
hope this can help!
If you want more customized results:
Please try to click on the red triangle at
the top, and select Estimates > Custom
Test.
95% CI
Learn how to manually calculate odds ratios using JMP results. Follow step-by-step instructions to convert parameter estimates, derive odds ratios, and interpret results with confidence. Enhance your statistical analysis skills today!

Download Presentation

Please find below an Image/Link to download the presentation.
The content on the website is provided AS IS for your information and personal use only. It may not be sold, licensed, or shared on other websites without obtaining consent from the author.If you encounter any issues during the download, it is possible that the publisher has removed the file from their server.
You are allowed to download the files provided on this website for personal or commercial use, subject to the condition that they are used lawfully. All files are the property of their respective owners.
The content on the website is provided AS IS for your information and personal use only. It may not be sold, licensed, or shared on other websites without obtaining consent from the author.
E N D
Presentation Transcript
Calculate Odds Ratio by hand using JMP results Meichen Dong 12/16/2021
Example: sal1.jmp Y: ybin Fixed Effects: fpop, mpop, fpop*mpop Random Effects: fpop*fnum, mpop*mnum
Right click on Parameter Estimates table in the JMP report Select Make into data table , and you will derive a new table as below:
Using the parameter estimate table Select estimate and std err columns Right click Select New Formula Column > Transform since we used logit link for binomial outcome, which is the form of log ? = ? + ?? + ??. 1 ? The odds ratio can be derived by taking the exponential of the estimates. You will get two new columns:
Odds Ratio calculation example: https://www.proteus.co.nz/news-tips-and-tricks/how-to-calculate- odds-ratios-from-logistic-regression-coefficients/ This link provides a simple example of how to calculate OR by hand. I hope this can help!
If you want more customized results: Please try to click on the red triangle at the top, and select Estimates > Custom Test.
95% CI For example, our estimate for the parameter fpop s coefficient is 0.68, with stderr = 0.38. This means, controlling for other variables, ??????= exp 0.68 1.97 95% CI by hand: Lower limit: 0.68 1.96 0.38 = 0.0648,?? = exp 0.0648 0.94 Upper limit: 0.68 + 1.96 0.38 = 1.4248, ?? = exp 1.4248 4.16 In sum, the 95% CI is (0.94, 4.16), which includes 1, indicating that the OR for this variable is not statistically significant. Hence, you need to create two new columns: SEE THE FOLLOWING PAGE If your variable of interest is continuous, then that means for 1 unit increment, the likelihood increase by xxx. Nominal, then that means the OR between the selected level to the reference level.