Five Steps to Achieve Seamless Data Integration with Your Dashboard Tool
nFor your decisions to be derived from data, the ability to seamlessly integrate diverse data streams into a cohesive dashboard is more than a technical achievement; it's a competitive advantage. But what does it truly take to achieve seamless data integration with your Business Intelligence dashboard tools?n
Download Presentation

Please find below an Image/Link to download the presentation.
The content on the website is provided AS IS for your information and personal use only. It may not be sold, licensed, or shared on other websites without obtaining consent from the author. If you encounter any issues during the download, it is possible that the publisher has removed the file from their server.
You are allowed to download the files provided on this website for personal or commercial use, subject to the condition that they are used lawfully. All files are the property of their respective owners.
The content on the website is provided AS IS for your information and personal use only. It may not be sold, licensed, or shared on other websites without obtaining consent from the author.
E N D
Presentation Transcript
Five Steps to Achieve Seamless Data Integration with Your Dashboard Tool -------------------------------------------------------------------------------------------------- Not being on the ground meant that the information started to become more scattered and I didn t have the same feel for the sales numbers, ops stats, and customer service figures. Have you ever felt like Patrick Jungo, co-founder of Edit Suits Co., when trying to manage your business's data? As businesses grow and expand, it's common to find your data spreading out as wide as your operations. But what happens when this scattered data starts affecting your ability to make informed decisions?
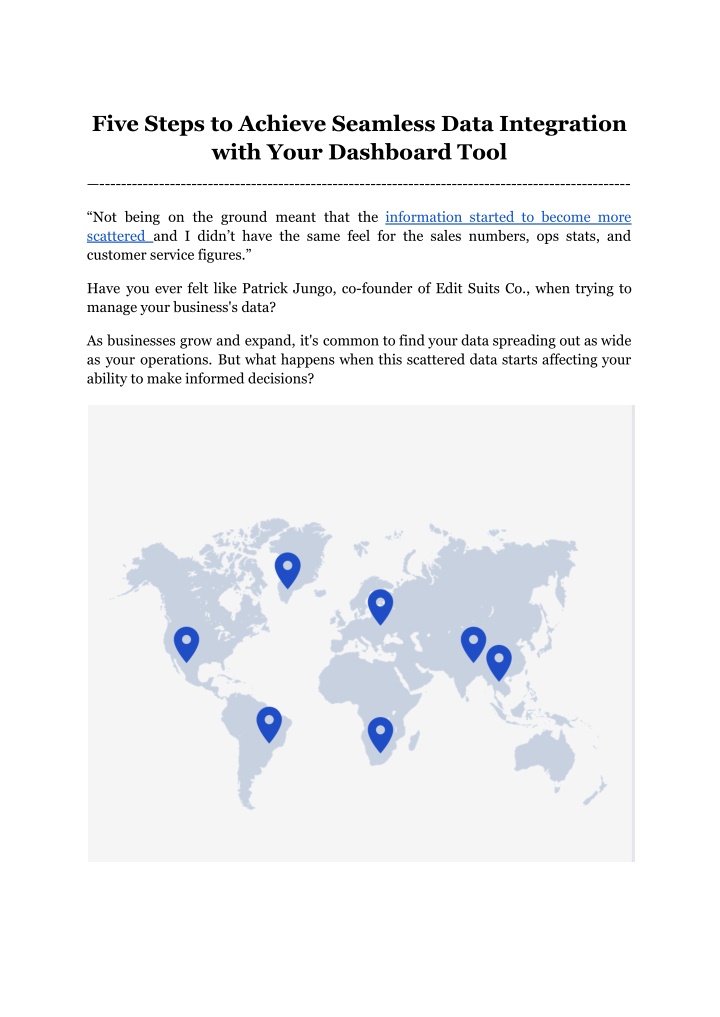
Imagine having operations in two different continents, like Edit Suits Co. did, with showrooms in London and Singapore. How do you keep track of everything when your data feels like it's everywhere? The challenge Edit Suits faced is not unique; it's something many businesses encounter. The question then becomes, how do you bring all this scattered information together to get a clear picture of your business? This is where the importance of seamless data integration in your dashboard tool comes into play. Wouldn't it be a game-changer to have all your essential data in one place, easily accessible and ready to inform your decisions? That's precisely the journey we're about to embark on with this blog. Ready to find out how you can keep your finger on the pulse of your operations, no matter where you or your data are? Let's dive in and discover how seamless data integration in dashboard Business Intelligence can be your business's new superpower. Five Steps to Achieve Seamless Data Integration with Your Dashboard Tool Step 1: Evaluate and Understand Your Data Landscape Data Integration Architecture: Begin with a detailed architectural assessment of your data ecosystem. Implement a metadata management strategy to catalog data sources, schemas, and lineage. This foundational step ensures that your BI team can trace data back to its origin, critical for diagnosing issues or understanding the context of the data within your Business Intelligence dashboards. Advanced Data Quality Techniques: Beyond basic quality checks, employ statistical and machine learning algorithms to identify anomalies, patterns, and trends in your data. Techniques such as predictive modeling and sentiment analysis can enrich your understanding of the data, providing deeper insights for more sophisticated dashboard Business Intelligence. Step 2: Choose the Right Dashboard Tool BI Tool Evaluation Metrics: When selecting a dashboard tool, consider advanced metrics such as the tool's ability to support complex data models, its performance under heavy query loads, and the flexibility of its data visualization capabilities. The integration of OLAP (Online Analytical Processing) cubes for multi-dimensional analysis can significantly enhance the analytical power of your Business Intelligence dashboards. Custom Development and APIs: Evaluate the extent to which a dashboard tool supports custom development, including the availability of APIs for integrating
custom data sources or embedding dashboard components into other applications. This flexibility is crucial for organizations with unique or evolving BI needs. Step 3: Establish a Robust Data Integration Framework Data Warehousing Solutions: Discuss the role of modern data warehousing solutions like Snowflake, BigQuery, or Redshift in supporting your BI dashboards. These platforms offer massive scalability and speed, enabling real-time data analysis and integration without the traditional overhead of on-premise data warehouses. Data Transformation Technologies: Delve into specific data transformation technologies and frameworks, such as Apache Spark or Talend, which can process large volumes of data efficiently. Highlight the importance of streamlining the data transformation process to ensure that data is dashboard-ready, focusing on transformations like normalization, deduplication, and aggregation for optimal dashboard performance. Step 4: Ensure Data Security and Compliance Advanced encryption standards, such as TLS (Transport Layer Security) for data in transit and AES (Advanced Encryption Standard) for data at rest. Discuss how role-based access control (RBAC) and attribute-based access control (ABAC) can be implemented to fine-tune access rights to the Business Intelligence dashboards and underlying data. Security Protocols: Explore advanced security protocols and Grow prioritizes data security by employing advanced protocols like TLS for data in transit and AES for data at rest, ensuring robust protection. Each Grow account benefits from a dedicated Data Pod, enhancing both performance and security through isolation, with it s advanced security measures integrated within Business Intelligence dashboard tools. Committed to maintaining the highest security standards, Grow is SOC 2 compliant, independently audited to safeguard your data meticulously, underscoring its reliability among BI dashboard tools.
Compliance Automation Tools: Highlight the use of compliance automation tools and services that help manage the data governance landscape, ensuring continuous compliance with ever-changing regulations. Business Intelligence dashboard tools that automatically map data flows and identify sensitive information can greatly reduce the compliance burden. Step 5: Train Your Team and Build a Data-Driven Culture BI Competency Centers (BICC): Advocate for the establishment of a BI Competency Center or similar entity within your organization. This team leads BI initiatives, ensuring that BI practices are aligned with business objectives, and plays a crucial role in fostering a data-driven culture by serving as a hub for BI resources, best practices, and support.
Continuous Learning Platforms: Emphasize the importance of investing in continuous learning platforms and resources for your team. Platforms offering courses on data analytics, visualization best practices, and the latest BI technologies can keep your team at the forefront of BI developments, ensuring your dashboards continue to deliver actionable insights. Conclusion Navigating the complexities of integrating data into Business Intelligence dashboards can transform raw data into strategic business insights, propelling your decision-making processes into new realms of efficiency and accuracy. These five detailed steps provide a roadmap for businesses to harness their dashboard tools, not just for aggregating data but for unlocking actionable insights that drive strategy, ensure operational security, and amplify the overall impact of their BI initiatives. In embracing this strategic approach to data integration, businesses position themselves to outpace competitors, cultivate a deeply ingrained culture of data-driven decision-making, and chart a course toward achieving their expansive strategic goals. The journey towards enhanced data utility and dashboard effectiveness is both a commitment and an investment in your organization's future. To embark on this journey with confidence, consider leveraging cutting-edge tools like Grow. Grow's BI dashboard tools are designed to simplify complex data integration, offering intuitive, powerful solutions that empower businesses to visualize their data landscape vividly. With Grow, real-time insights and informed decision-making are within reach, ensuring that your data not only informs but also transforms your business strategy. Why not experience the transformative power of Grow firsthand? Take advantage of Grow's 14-day free trial to explore how seamless data integration can elevate your BI dashboards. Dive into the world of data-driven decision-making with no commitments and discover the impact of actionable insights on your business operations. For those on the fence, consider exploring "Grow Reviews 2024". Check out the experiences of over 20000 businesses like yours, detailing how Grow has revolutionized their data integration and BI efforts. Let their stories guide your decision, illustrating the tangible benefits and competitive edge that Grow's Business Intelligence dashboard tools can bring to your organization.

