Predicting Crop Yield Using JMP's Functional Data Explorer
Crop yield prediction based on historical weather data in Ohio using JMP's Functional Data Explorer. A regression model is developed to forecast corn yield, correlating weather variables like temperature, rainfall, humidity, etc. Results show insights into weather patterns affecting crop yields, potentially influencing future crop prices. GenReg models were used to predict 2018 corn yield in Ohio, comparing actual and predicted values to analyze critical predictors.
Download Presentation

Please find below an Image/Link to download the presentation.
The content on the website is provided AS IS for your information and personal use only. It may not be sold, licensed, or shared on other websites without obtaining consent from the author.If you encounter any issues during the download, it is possible that the publisher has removed the file from their server.
You are allowed to download the files provided on this website for personal or commercial use, subject to the condition that they are used lawfully. All files are the property of their respective owners.
The content on the website is provided AS IS for your information and personal use only. It may not be sold, licensed, or shared on other websites without obtaining consent from the author.
E N D
Presentation Transcript
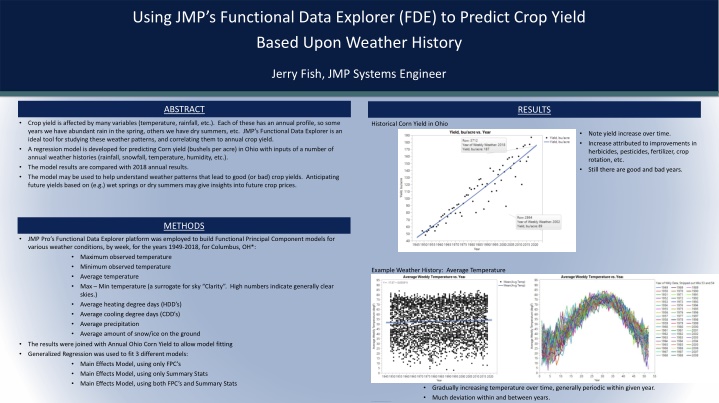
Using JMPs Functional Data Explorer (FDE) to Predict Crop Yield Based Upon Weather History Jerry Fish, JMP Systems Engineer ABSTRACT RESULTS Crop yield is affected by many variables (temperature, rainfall, etc.). Each of these has an annual profile, so some years we have abundant rain in the spring, others we have dry summers, etc. JMP s Functional Data Explorer is an ideal tool for studying these weather patterns, and correlating them to annual crop yield. A regression model is developed for predicting Corn yield (bushels per acre) in Ohio with inputs of a number of annual weather histories (rainfall, snowfall, temperature, humidity, etc.). The model results are compared with 2018 annual results. The model may be used to help understand weather patterns that lead to good (or bad) crop yields. Anticipating future yields based on (e.g.) wet springs or dry summers may give insights into future crop prices. Historical Corn Yield in Ohio Note yield increase over time. Increase attributed to improvements in herbicides, pesticides, fertilizer, crop rotation, etc. Still there are good and bad years. METHODS JMP Pro s Functional Data Explorer platform was employed to build Functional Principal Component models for various weather conditions, by week, for the years 1949-2018, for Columbus, OH*: Maximum observed temperature Minimum observed temperature Average temperature Max Min temperature (a surrogate for sky Clarity . High numbers indicate generally clear skies.) Average heating degree days (HDD s) Average cooling degree days (CDD s) Average precipitation Average amount of snow/ice on the ground Example Weather History: Average Temperature dv The results were joined with Annual Ohio Corn Yield to allow model fitting Generalized Regression was used to fit 3 different models: Main Effects Model, using only FPC s Main Effects Model, using only Summary Stats Main Effects Model, using both FPC s and Summary Stats Gradually increasing temperature over time, generally periodic within given year. Much deviation within and between years. /*JMPType:FrameScript*/{Frame Size(484, 392), Left(1), Right(1), Top(1), Bottom(1), Set Background Color(2), Marker Size(-1), Marker Drawing Mode("Normal"), Line Width Scale(1), Transparency(1)}
Using JMPs Functional Data Explorer (FDE) to Predict Crop Yield Based Upon Weather History Jerry Fish, JMP Systems Engineer RESULTS CONTINUED FDE was used to fit B-splines to the historical weekly weather patterns. (see plot at right) These splines were then decomposed into Functional Principal Components (FPC s) (see below) Note: Only first 2 of 10 FPC s are shown.
Using JMPs Functional Data Explorer (FDE) to Predict Crop Yield Based Upon Weather History Jerry Fish, JMP Systems Engineer RESULTS CONTINUED FDE was used to fit B-splines to the historical weekly weather patterns. These splines were then decomposed into Functional Principal Components (FPC s) (see below) Note: Only first 2 of 10 FPC s are shown for first predictor (Max Temp)
Using JMPs Functional Data Explorer (FDE) to Predict Crop Yield Based Upon Weather History Jerry Fish, JMP Systems Engineer RESULTS CONTINUED 3 Main Effects models were fitted using GenReg: Model 1: Using only FPC s for all predictors (total 63 predictors) Model 2: Using only Summary Stats for all predictors (total 72 predictors) Model 3: Using all FPC s and Summary Stats (total 135 predictors) GenReg then eliminated all statistically insignificant terms, leaving this model summary: The 3rd(best) model was used to predict 2018 Yield: 2018 Actual Yield: 187 Bu/Acre 2018 Predicted Yield: 150 38 Bu/Acre Critical Predictors leading to High Yield FPC s Surrogate Clarity FPC2 Higher is Better HDD FPC3 Lower is Better Several interactions (difficult to interpret) Summary Statistics Minimum Annual Temperature Higher is Better Median Minimum Weekly Temperature Higher is Better Root Integrated Squared Function for Min Temp Higher is Better Maximum Annual Temperature
Using JMPs Functional Data Explorer (FDE) to Predict Crop Yield Based Upon Weather History Jerry Fish, JMP Systems Engineer CONCLUSIONS Weather patterns can be used to predict annual Corn Yield High corn yield predicted in years with: Generally elevated minimum temperatures and high maximum temperatures Patterns such as decreasing clarity as the year progresses (Clarity FPC2) Suggested Improvements Add more functions to the model Average over the entire region/state (these models based only on Columbus OH Airport Data) Try other models (partitioning, Neural Nets, etc) to improve modeling accuracy REFERENCES Ohio Corn Yield from USDA website: Field crops: Corn: Yield, measured in Bu/Acre, for Ohio Daily Historical Weather from the National Weather Service for Columbus, OH airport Template provided by ePosterBoards
