Analysis of Revenue Breakdown Across Various Industries
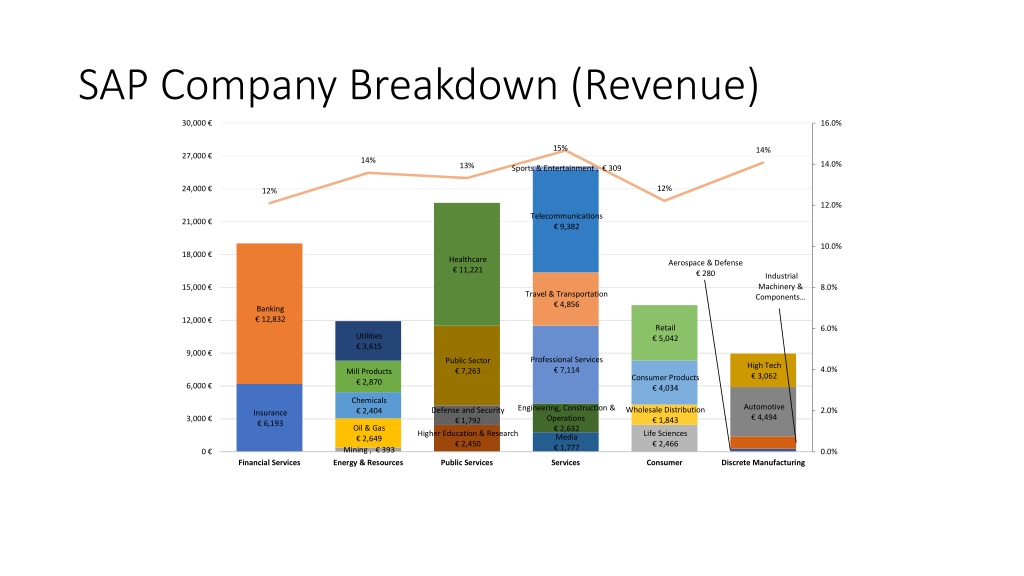
This analysis provides insights into the revenue breakdown of a company across different industries like Sports & Entertainment, Telecommunications, Healthcare, Aerospace & Defense, and more. It includes revenue figures, percentages, and industry segmentation.

Download Presentation

Please find below an Image/Link to download the presentation.
The content on the website is provided AS IS for your information and personal use only. It may not be sold, licensed, or shared on other websites without obtaining consent from the author. Download presentation by click this link. If you encounter any issues during the download, it is possible that the publisher has removed the file from their server.
E N D
Presentation Transcript
SAP Company Breakdown (Revenue) 30,000 16.0% 15% 14% 27,000 14% 14.0% 13% Sports & Entertainment , 309 12% 24,000 12% 12.0% Telecommunications 9,382 21,000 10.0% 18,000 Healthcare 11,221 Aerospace & Defense 280 Industrial Machinery & Components 15,000 8.0% Travel & Transportation 4,856 Banking 12,832 12,000 Retail 5,042 6.0% Utilities 3,615 9,000 Professional Services 7,114 Public Sector 7,263 High Tech 3,062 4.0% Mill Products 2,870 Consumer Products 4,034 6,000 Chemicals 2,404 Automotive 4,494 Engineering, Construction & Operations 2,632 Wholesale Distribution 1,843 Defense and Security 1,792 2.0% Insurance 6,193 3,000 Oil & Gas 2,649 Life Sciences 2,466 Higher Education & Research 2,450 Media 1,777 Mining , 393 Energy & Resources 0 0.0% Financial Services Public Services Services Consumer Discrete Manufacturing
ASUG Industry Breakdown (Count) 500 450 39 400 88 350 300 8 250 24 95 2 18 20 200 64 38 12 32 319 34 150 38 58 80 37 52 100 104 103 50 82 76 21 23 0 Financial Services Energy & Resources Public Services Services Consumer Discreet Manufacturing
ASUG Data Consumer Consumer Products Retail Wholesale Distribution Discreet Manufacturing Aerospace & Defense Automotive Engineering, Construction and Operations High Tech Industrial Machinery & Components Energy & Resources Chemicals Mill Products Mining Oil & Gas Utilities Financial Services Banking Insurance Public Services Defense & Security Healthcare Higher Education & Research Public Sector Services Engineering, Construction and Operations Healthcare Media Professional Services Sports & Entertainment Telecommunications Travel & Transportation Grand Total 446 319 88 39 216 20 58 2 32 104 258 82 8 24 64 80 44 23 21 186 12 34 37 103 236 52 38 5 76 9 18 38 1386
DiscoverOrg Industry Breakdown (Count) 6000 119 69 198 5000 215 405 596 4000 504 3000 648 912 2000 3902 1091 521 2565 44 177 1000 65 1153 197 1059 963 221 240 0 Financial Services Energy & Resources Public Services Services Consumer Discreet Manufacturing
DiscoverOrg Data Consumer Consumer Products Retail Wholesale Distribution Discrete Manufacturing Automotive Defense & Aerospace High Tech Energy & Resources Chemicals Mining Oil & Gas Utiliities Financial Services Banking Insurance Public Services Heathcare Higher Education & Research Public Sector Services Engineering, Construction and Operations Healthcare Media Professional Services Sports & Entertainment Telecommunications Travel & Transportation Grand Total 3717 2565 648 504 1184 177 44 963 723 240 65 197 221 1580 1059 521 3156 1153 912 1091 5504 405 215 119 3902 69 198 596 15864
")
")

")