ALA FY 2017 Financial Report Summary
ALA's FY 2017 financial report highlights total revenues, expenses, net operating revenue, revenue sources, general fund summary, and detailed revenue and expense breakdowns. Revenues amounted to $48,808,627 with net revenue of $314,944. Key revenue sources included dues, contributions, grants, and publishing. Expenses totaled $50,946,547. The report offers insights into ALA's financial performance for the year, emphasizing revenue diversification and expenditure allocation.
Download Presentation

Please find below an Image/Link to download the presentation.
The content on the website is provided AS IS for your information and personal use only. It may not be sold, licensed, or shared on other websites without obtaining consent from the author. Download presentation by click this link. If you encounter any issues during the download, it is possible that the publisher has removed the file from their server.
E N D
Presentation Transcript
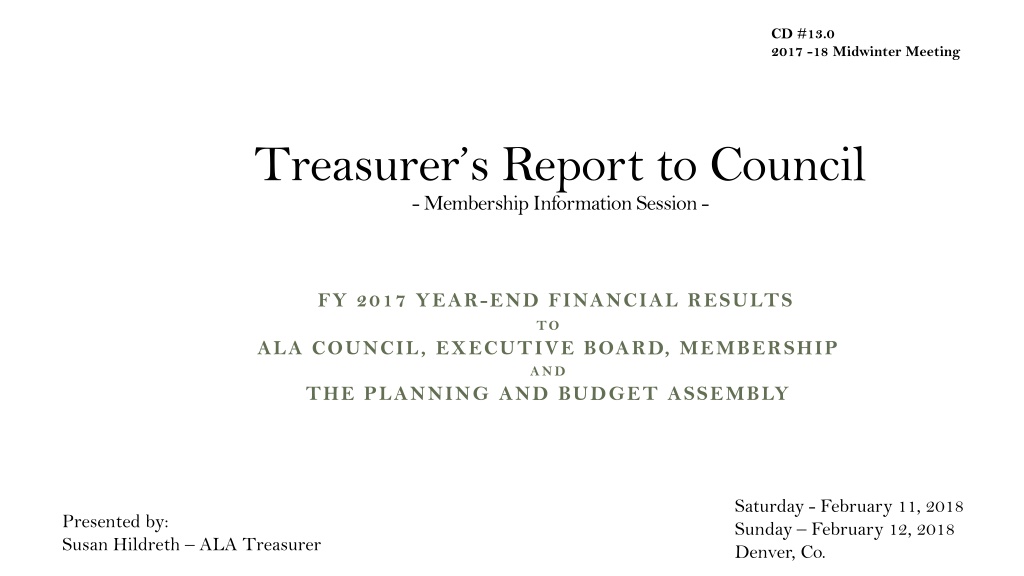
CD #13.0 2017 -18 Midwinter Meeting Treasurer s Report to Council - Membership Information Session - FY 2017 YEAR-END FINANCIAL RESULTS TO ALA COUNCIL, EXECUTIVE BOARD, MEMBERSHIP AND THE PLANNING AND BUDGET ASSEMBLY Saturday - February 11, 2018 Sunday February 12, 2018 Denver, Co. Presented by: Susan Hildreth ALA Treasurer
How Did We Do? - Total ALA - FY 2017, FY 2016 AND FY 2015 $(2,137,920) 2017 2016 2015 2017 $50,946,547 $48,808,627 Revenues $ 48,808,627 $ 51,897,784 $ 51,679,590 $531,835 2016 $51,365,949 Expenses $ 50,946,547 $ 51,365,949 $ 51,364,646 $51,897,784 Net Operating Revenue(Expenses) $314,944 $( 2,137,920) $ 531,835 $ 314,944 2015 $51,364,646 $51,679,590 $(10,000,000) $- $10,000,000 $20,000,000 $30,000,000 $40,000,000 $50,000,000 $60,000,000 Net Operating Revenue Expenses Revenues 2
OTHER $3,000,028 DIVIDENDS & INTEREST INCOME: $1,628,272 CONTRIBUTIONS $1,391,534 GRANTS & AWARDS $6,319,708 MEETINGS & CONFERENCES $11,695,804 PUBLISHING $16,762,048 DUES $8,115,536 $- $2,000,000 $4,000,000 $6,000,000 $8,000,000 $10,000,000 $12,000,000 $14,000,000 $16,000,000 $18,000,000 3 Where Did Our Revenue Come From?
General Fund Summary 2017 2016 2015 $ 27,669,658 $ 27,305,345 $ 29,024,423 Revenues $ 29,002,985 $ 27,972,577 $ 28,745,049 Expenses $ (1,333,327) $ (667,232) $ 279,374 Net Revenue 4
General Fund Revenues 2017 2016 2015 $ 5,363,955 $ 5,592,444 $ 5,480,185 Dues $ 11,491,870 $ 12,167,044 $ 12,978,793 Publishing Meetings & Conferences Interest & Dividends Contributions $ 7,960,980 $ 7,047,615 $ 7,783,575 $ 1,333,533 $ 1,168,625 $ 1,087,785 $ 213,089 $ 190,020 $ 238,228 Miscellaneous $ 1,306,303 $ 1,139,597 $ 1,455,857 Total $ 27,669,658 $ 27,305,345 $ 29,024,423 5
General Fund Expenses 2017 2016 2015 $ 15,172,577 $ 4,342,135 $ 1,004,247 $ 3,830,480 $ 2,079,003 $ 2,324,084 $ 250,459 $ 14,323,038 $ 13,941,468 $ 4,312,669 $ 4,109,241 $ 1,073,904 $ 970,076 $ 3,896,371 $ 4,044,220 $ 2,261,921 $ 2,379,129 $ 1,744,278 $ 2,406,458 $ 360,396 $ 404,790 $ 27,972,577 $ 28,255,382 Payroll Outside Services Travel Meetings & Conferences Publications Operating & Overhead Interunit Transfers Total Expenses $ 29,002,985 6
General Fund Net Revenue Sources 2017 - and other support - Overhead Support Total Support Revenues $ 1,333,533 $ 0 $ 1,333,533 Interest & Earnings Membership Dues - Net $ 5,363,955 $ 0 $ 5,363,955 $ 479,990 $ 2,909,300 $ 3389,290 Publishing - Net Meetings & Conferences - Net Other $ 752,015 $ 2,482,732 $ 3,234,747 $ 612,489 Total $ 8,814,982 $ 7,473,001 $ 16,014,983 $ 2,080,969* $ 2,693,458 *Overhead contribution from Divisions, Roundtables and Grants 7
Publishing Revenues & Expenses 2017 Overhead Contribution Net Revenues $ 2,646,320 $ 3,240,649 $ 698,543 $ 4,760,677 $ 3,792,156 $ 1,236,819 $ 697,649 $ 767,301 $ 184,094 Digital Resources $ 1,188,547 $ 1,143,957 $ 324,087 American Libraries $ 934,513 $ 934,513 $ 247,038 E-Learning $ 798,261 $ 743,817 $ 224,921 Publishing - AED $ - $ (76,416) $ 0 Total $ 11,025,967 $ 10,545,977 $ 2,909,300 Expenses Revenue $ (594,329) $ 968,521 $ (69,652) $ 44,590 ALA Editions Booklist Graphics $ - $ - $ (76,416) $ 272,714 8
Meetings & Conferences Revenues and Expenses - 2017 Overhead Contribution* Net Revenues Expenses Revenue Annual Conference $ 6,660,599 $ 5,828,583 $ 1,758,398 $ 832,016 Midwinter Meeting $ 2,743,689 $ 2,823,690 $ 724,334 $ (80,001) Total$ 8,349,976 $ 8,304,105 $ 2,482,732 $ 752,015 *Overhead contributed to the General Fund 9
Division Revenues and Expenses 2017 $(410,346) 2017 $14,216,320 $13,805,974 $713,842 2016 $15,096,764 $15,810,606 $(328,748) 2015 $14,637,658 $14,308,910 $(2,000,000) $- $2,000,000 $4,000,000 $6,000,000 $8,000,000 $10,000,000 $12,000,000 $14,000,000 $16,000,000 $18,000,000 Net Revenue Expenses Revenues 10
Roundtable Revenues and Expenses 2017 $199,116 2017 $268,338 $467,454 $205,016 2016 $229,911 $434,927 $165,038 2015 $263,737 $428,775 $- $50,000 $100,000 $150,000 $200,000 $250,000 $300,000 $350,000 $400,000 $450,000 $500,000 Net Revenue Expenses Revenues 11
Total ALA Assets, Liabilities & Net Assets 2017 2017 2016 2015 $ 72,513,440 $ 75,727,502 $ 77,572,339 Assets $ 32,622,113 $ 45,343,837 $ 46,034,318 Liabilities $ 39,891,327 $ 30,383,665 $ 31,538,021 Net Assets 12
Strategy to Address FY 19 and Beyond Leverage strong balance sheet to fund investments that will generate revenue and reduce operating expenses Endowment loan ALA line of credit Bank debt supported by value of buildings/other assets 14
Strategy to Address for FY 19 and Beyond Consider the best use of the ALA Headquarters Commission analysis of best use of building Consider how to provide most efficient and modern staff work environment Take advantage of all opportunities to streamline the organization and workflow New Business Development Committee revitalized 15
