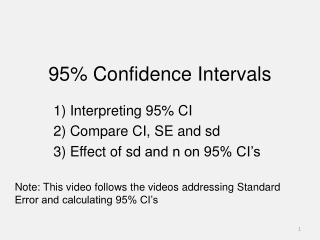
Understanding Confidence Intervals in Statistics
Confidence intervals provide a range of plausible values for a parameter, increasing our confidence in the estimate. In this context, you will learn to interpret confidence intervals, determine point estimates and margins of error, and make decisions based on confidence intervals. The concept is essential for drawing conclusions about population parameters based on sample statistics.

Download Presentation

Please find below an Image/Link to download the presentation.
The content on the website is provided AS IS for your information and personal use only. It may not be sold, licensed, or shared on other websites without obtaining consent from the author. Download presentation by click this link. If you encounter any issues during the download, it is possible that the publisher has removed the file from their server.
E N D
Presentation Transcript
Estimating a Parameter Lesson 7.1 The Idea of a Confidence Interval Statistics and Probability with Applications, 3rdEdition Starnes & Tabor Bedford Freeman Worth Publishers
The Idea of a Confidence Interval Learning Targets After this lesson, you should be able to: Interpret a confidence interval in context. Determine the point estimate and margin of error from a confidence interval. Use confidence intervals to make decisions. Statistics and Probability with Applications, 3rdEdition 2 2
Whats the Mystery Mean? In this activity, each team of three or four students will try to estimate the mystery value of the population mean ? that your teacher chose before class. 1. Before class, your teacher stored a value of ? (represented by M) in the display calculator. Your teacher then cleared the home screen, so you can t see the value of M. With the class watching, the teacher will execute the following command: mean(randNorm(M,20,16)) This tells the calculator to choose an SRS of 16 values from a normal population with mean M and standard deviation 20, and then compute the mean ? of those 16 sample values. Is the sample mean shown likely to be equal to the mystery mean M? Why or why not? Determine an interval of plausible (reasonable) values for the population mean ?. Use the result from Step 2 and what you learned about sampling distributions in Chapter 6. Share your team s results with the class. 2. 3. 4. Statistics and Probability with Applications, 3rdEdition 3 3
The Idea of a Confidence Interval Chapter 7 begins the formal study of statistical inference using information from a sample to draw conclusions about a population parameter such as p or . One of the most common tasks of a statistician is using a sample statistic to estimate the value of a parameter. Confidence Interval A confidence interval gives an interval of plausible (reasonable) values for a parameter. Plausible means that we shouldn t be surprised if any one of the values in the interval is equal to the value of the parameter. We use an interval of plausible values rather than a single-value estimate to increase our confidence that we have a correct value for the parameter. Statistics and Probability with Applications, 3rdEdition 4 4
The Idea of a Confidence Interval Confidence intervals are constructed so that we know how much confidencewe should have in the interval. The most common confidence level is 95% Confidence Level The confidence level Cgives the long-run success rate of confidence intervals calculated with C% confidence. That is, in C% of all possible samples, the interval computed from the sample data will capture the true parameter value. How to Interpret a Confidence Interval To interpret a C% confidence interval for an unknown parameter, say, We are C% confident that the interval from____to____captures the [parameter in context]. Statistics and Probability with Applications, 3rd Edition 5 5
Americas got talent? Interpreting a confidence interval PROBLEM: A recent Gallup poll asked a random sample of 1010 Americans to respond to the statement If the U.S. fails to develop a more talented workforce, it will fall behind other countries. The 95% confidence interval for the proportion who would respond Strongly agree or Agree is 0.74 to 0.82. Interpret this confidence interval. We are 95% confident that the interval from 0.74 to 0.82 captures the true proportion of all Americans who would respond Strongly agree or Agree. Statistics and Probability with Applications, 3rd Edition 6 6
The Idea of a Confidence Interval To create an interval of plausible values for a parameter, we need two components: a point estimate to use as the midpoint of the interval and a margin of error to account for sampling variability. The structure of a confidence interval is: point estimate margin of error Statistics and Probability with Applications, 3rd Edition 7 7
The Idea of a Confidence Interval The point estimate is our best guess for the value of the parameter. Unfortunately, the point estimate is unlikely to be correct because of the variability introduced by random sampling. We include the margin of error to account for this sampling variability. Point Estimate, Margin of Error A point estimate is a single-value estimate of a population parameter. The margin of error of an estimate describes how far, at most, we expect the estimate to vary from the true population value. That is, in a C% confidence interval, the distance between the point estimate and the true parameter value will be less than the margin of error in C% of all samples. Statistics and Probability with Applications, 3rd Edition 8 8
Americas got more talent? Determining the point estimate and margin of error PROBLEM: In the previous example, you learned that the 95% confidence interval for the true proportion of all Americans who would respond Strongly agree or Agree is 0.74 to 0.82. Calculate the point estimate and margin of error used to create this confidence interval. Point estimate =?.??+?.?? = ?.?? ? Margin of error = ?.?? ?.?? = ?.?? Statistics and Probability with Applications, 3rd Edition 9 9
Is the cafeteria compliant? Using confidence intervals to make decisions PROBLEM: USDA guidelines recommend that no more than 30% of calories should come from fat. A school nurse selected a random sample of meals served by the cafeteria and calculated the percent of calories from fat in each meal. The resulting 90% confidence interval for the true mean percent of calories from fat in school meals is 29% to 39%. Is there convincing evidence that the true percent of calories from fat in all meals served by the cafeteria is greater than the USDA recommendation? Explain. No. Because the value 30% is contained in the interval, it is plausible that the true mean percent of calories from fat in school meals is 30%. Statistics and Probability with Applications, 3rd Edition 10 10
LESSON APP 7.1 Do you approve of the president s job performance? Polling organizations regularly survey U.S. adults to ask if they approve of the job the president is doing. On the day of the 2014 midterm elections, the 95% confidence interval for the proportion of all U.S. adults that approved of President Obama s job performance was 0.39 to 0.45. 1. 2. Interpret the confidence interval. Calculate the point estimate and margin of error used to create this confidence interval. Is it plausible that on the day of the 2014 midterm elections, a majority of U.S. adults approved of President Obama s job performance? Explain. 3. Statistics and Probability with Applications, 3rd Edition 11 11
LESSON APP 7.1 1. Interpret the confidence interval. Do you approve of the president s job performance? 2. Calculate the point estimate and margin of error used to create this confidence interval. 3. Is it plausible that on the day of the 2014 midterm elections, a majority of U.S. adults approved of President Obama s job performance? Explain. Statistics and Probability with Applications, 3rd Edition 12 12
The Idea of a Confidence Interval Learning Targets After this lesson, you should be able to: Interpret a confidence interval in context. Determine the point estimate and margin of error from a confidence interval. Use confidence intervals to make decisions. Statistics and Probability with Applications, 3rd Edition 13 13