Understanding Normal Distribution Calculations in Statistics

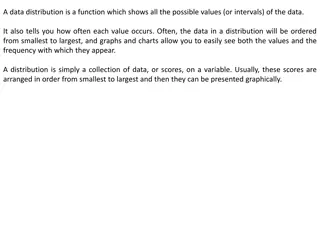
Exploring normal distribution calculations in Statistics involves calculating probabilities within intervals and finding values corresponding to given probabilities. This lesson delves into the application of normal distribution to determine probabilities of scoring below a certain level on tests and identifying percentiles in a distribution. By drawing normal distributions, standardizing values, and utilizing technology or tables, one can effectively analyze and interpret data using statistical principles.

Download Presentation

Please find below an Image/Link to download the presentation.
The content on the website is provided AS IS for your information and personal use only. It may not be sold, licensed, or shared on other websites without obtaining consent from the author. Download presentation by click this link. If you encounter any issues during the download, it is possible that the publisher has removed the file from their server.
E N D
Presentation Transcript
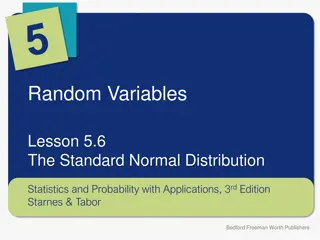
Random Variables Lesson 5.7 Normal Distribution Calculations Statistics and Probability with Applications, 3rdEdition Starnes & Tabor Bedford Freeman Worth Publishers
Normal Distribution Calculations Learning Targets After this lesson, you should be able to: Calculate the probability that a value falls within a given interval in a normal distribution. Find a value corresponding to a given probability (area) in a normal distribution. Statistics and Probability with Applications, 3rdEdition 2 2
Normal Distribution Calculations In Lessons 5.5 and 5.6, we examined the continuous random variable X = the ITBS grade-equivalent vocabulary score for a randomly selected seventh-grade student in Gary, Indiana. The distribution is approximately normal with mean = 6.84 and standard deviation = 1.55. How can we compute the probability P(X < 4) that a randomly selected seventh-grader scores below the fourth-grade level on the ITBS vocabulary test? What test score would place a Gary seventh-grader at the 90th percentile of the distribution? Statistics and Probability with Applications, 3rdEdition 3 3
Normal Distribution Calculations How to Find Probabilities (Areas) in Any Normal Distribution 1. Draw a normal distribution with the horizontal axis labeled and scaled using the mean and standard deviation, the boundary value(s) clearly identified, and the area of interest shaded. 1. Perform calculations. Do one of the following: i. Standardize each boundary value and use Table A to find the desired probability (area) under the standard normal curve; or use technology to find the desired probability (area) without standardizing. Be sure to answer the question that was asked. ii. Statistics and Probability with Applications, 3rd Edition 4 4
Normal Distribution Calculations X = the ITBS grade-equivalent vocabulary score for a randomly selected seventh-grade student in Gary, Indiana. The distribution is approximately normal with mean = 6.84 and standard deviation = 1.55. What is P(X < 4)? P(X<4) P(X < 4) = P(Z < -1.83) = 0.0336 There s about a 3% chance that a randomly selected Gary seventh- grader scores below the fourth-grade level on the ITBS vocabulary test. Statistics and Probability with Applications, 3rd Edition 5 5
Normal Distribution Calculations How to Find Values from Probabilities (Areas) in Any Normal Distribution 1. Draw a normal distribution with the horizontal axis labeled and scaled using the mean and standard deviation, with the horizontal axis labeled and scaled using the mean and standard deviation, the area of interest shaded, and unknown boundary value clearly marked. 1. Perform calculations. Do one of the following: i. Use Table A to find the value of z with the indicated area under the standard normal curve to the left of the boundary, then unstandardize to transform back to the original distribution; or use technology to find the boundary value from the probability (area) to the left of the boundary without standardizing. ii. Be sure to answer the question that was asked. Statistics and Probability with Applications, 3rd Edition 6 6
Can you taste the sweet sugary goodness? Can you taste the sweet sugary goodness? Calculating probabilities in a normal distribution Calculating probabilities in a normal distribution PROBLEM: Machines that fill bags with powdered sugar, also called confectioner s sugar, are supposed to dispense exactly 32 ounces of powdered sugar into each bag. Let X = the weight in ounces of the powdered sugar dispensed into a randomly selected bag. Suppose that X follows a normal distribution with mean 32 ounces and standard deviation 0.6 ounces. Find and interpret P(X 31). ? =?? ?? = ?.?? ?.? ?(? ??) = ?(? ?.??) ?.???? ?????????(?????: ????,?????:??,????:??,??:?.?) = ?.???? There s about a 5% chance that a randomly selected bag will contain 31 ounces or less of powdered sugar. Statistics and Probability with Applications, 3rd Edition 7 7
More sweet sugary goodness? More sweet sugary goodness? Calculating more complicated probabilities Calculating more complicated probabilities PROBLEM: Refer to the previous example. What percent of all bags contain 31 to 33 ounces of powdered sugar? ? =?? ?? = ?.?? ?.? ? =?? ?? = ?.?? ?.? ? ?? ? ?? = ? ?.?? ? ?.?? ?.???? ?.???? ?.???? ?????????(?????:??,?????:??,????:??,??:?.?) = ?.???? About 90% of all bags have between 31 and 33 ounces of powdered sugar. Statistics and Probability with Applications, 3rd Edition 8 8
Normal Distribution Calculations What test score would place a Gary seventh-grader at the 90th percentile of the distribution? 1.28=x-6.84 1.55 1.28(1.55)= x-6.84 1.28(1.55)+6.84= x 8.824= x Statistics and Probability with Applications, 3rd Edition 9 9
Another truck stop? Another truck stop? Finding a value from a probability (area) Finding a value from a probability (area) PROBLEM: The stopping distances of emergency stops for a pickup truck on dry pavement from a speed of 62 mph are approximately normally distributed with = 155 ft and = 3 ft. Ten percent of all such emergency stops are less than what distance? Let X = the stopping distance of a randomly selected emergency stop. I want to find the value of X for which P(X < _____ ) = 0.10. ?.?? =? ??? ? ?.?? ? = ? ??? ?.?? ? + ??? = ? ???.?? = ? invNorm(area:0.10,mean:155,SD:3) = 151.16. About 10% of all emergency stops are less than 151.16 feet. Statistics and Probability with Applications, 3rd Edition 10 10
LESSON APP 5.7 What cholesterol levels are unhealthy for teen boys? High levels of cholesterol in the blood increase the risk of heart disease. For 14-year-old boys, the distribution of blood cholesterol is approximately normal with mean = 170 milligrams of cholesterol per deciliter of blood (mg/dl) and standard deviation = 30 mg/dl. Let X = the cholesterol level of a randomly selected 14-year-old boy. 1. Cholesterol levels above 240 mg/dl may require medical attention. Find and interpret P(X > 240). People with cholesterol levels between 200 and 240 mg/dl are at considerable risk for heart disease. What percent of 14-year-old boys have blood cholesterol between 200 and 240 mg/dl? What cholesterol level would place a 14-year-old boy at the 10th percentile of the distribution? 2. 3. Statistics and Probability with Applications, 3rd Edition 11 11
LESSON APP 5.7 What cholesterol levels are unhealthy for teen boys? 1. Cholesterol levels above 240 mg/dl may require medical attention. Find and interpret P(X > 240). ? ? > ??? = ????????? ?????:???,?????:????,? = ???,? = ?? = ?.???? There s about a 1% chance that a randomly selected 14-year old boy will have a cholesterol level above 240 mg/dl. 2. People with cholesterol levels between 200 and 240 mg/dl are at considerable risk for heart disease. What percent of 14-year-old boys have blood cholesterol between 200 and 240 mg/dl? ?(??? ? ???) = ????????? ?????:???,?????:???,? = ???,? = ?? = ?.???? There s about a 15% chance that a randomly selected 14-year old boy will have a cholesterol level between 200 and 240 mg/dl. 3. What cholesterol level would place a 14-year-old boy at the 10th percentile of the distribution? ? ? ___________ = ?.?? ? = ??????? ????:?.??,? = ???,? = ?? = ???.?? About 10% of 14-year old boys have a cholesterol level less than 131.55 mg/dl Statistics and Probability with Applications, 3rd Edition 12 12
Normal Distribution Calculations Learning Targets After this lesson, you should be able to: Calculate the probability that a value falls within a given interval in a normal distribution. Find a value corresponding to a given probability (area) in a normal distribution. Statistics and Probability with Applications, 3rd Edition 13 13