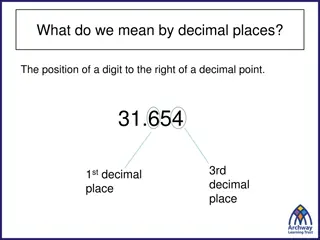
Understanding Rounding to Significant Figures and Error Intervals
Learn how to round numbers to significant figures and determine error intervals. Explore examples of rounding to different significant figures and calculating error ranges based on the rounding. Practice exercises included for a better understanding.

Download Presentation

Please find below an Image/Link to download the presentation.
The content on the website is provided AS IS for your information and personal use only. It may not be sold, licensed, or shared on other websites without obtaining consent from the author. Download presentation by click this link. If you encounter any issues during the download, it is possible that the publisher has removed the file from their server.
E N D
Presentation Transcript
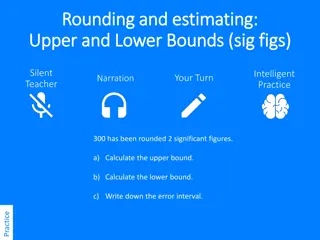
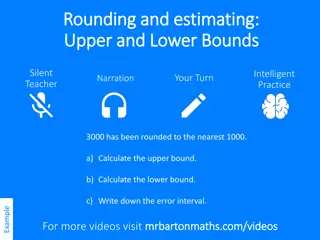
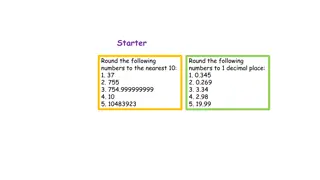
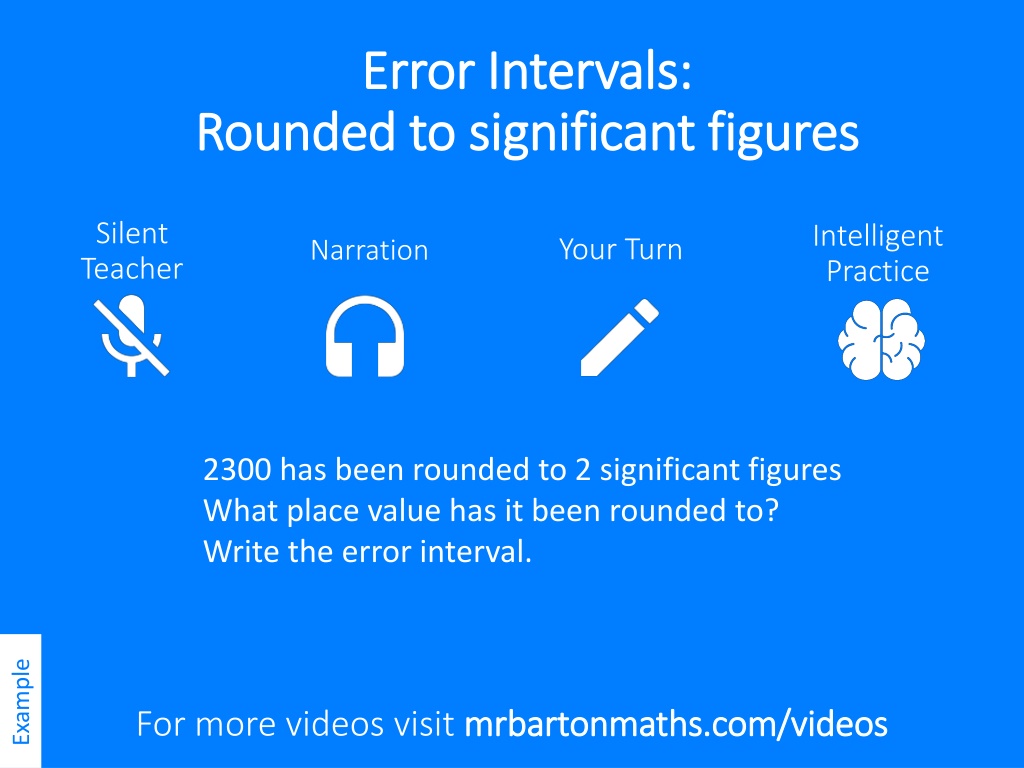
Error Intervals: Error Intervals: Rounded to significant figures Rounded to significant figures Silent Teacher Intelligent Practice Your Turn Narration 2300 has been rounded to 2 significant figures What place value has it been rounded to? Write the error interval. Example For more videos visit mrbartonmaths.com/videos mrbartonmaths.com/videos
Worked Example Your Turn 4200 has been rounded to 2 significant figures 3200 has been rounded to 2 significant figures a) What place value has it been rounded to? a) What place value has it been rounded to? b) Write the error interval. b) Write the error interval.
Value Rounded to Rounded to the nearest . Error Interval 4000 1 significant figure 5000 1 significant figure 6000 1 significant figure 600 1 significant figure 60 1 significant figure 6 1 significant figure 5300 2 significant figures 5200 2 significant figures 5100 2 significant figures 5000 2 significant figures 5320 3 significant figures 5310 3 significant figures 5300 3 significant figures 8000 3 significant figures 8000 2 significant figures 8000 1 significant figures 8 1 significant figures 0.8 1 significant figures 3.8 2 significant figures 3.7 2 significant figures 13.7 3 significant figures 1.37 3 significant figures 1.38 3 significant figures
Value Rounded to Rounded to the nearest . Error Interval 4000 1 significant figure 1000 3500 x < 4500 5000 1 significant figure 1000 4500 x < 5500 6000 1 significant figure 1000 5500 x < 6500 600 1 significant figure 100 550 x < 650 60 1 significant figure 10 55 x < 65 6 1 significant figure 1 5.5 x < 6.5 5300 2 significant figures 100 5250 x < 5350 5200 2 significant figures 100 5150 x < 5250 5100 2 significant figures 100 5050 x < 5150 5000 2 significant figures 100 4950 x < 5050 5320 3 significant figures 10 5315 x < 5325 5310 3 significant figures 10 5305 x < 5325 5300 3 significant figures 10 5295 x < 5305 8000 3 significant figures 10 7995 x < 8005 8000 2 significant figures 100 7950 x < 8050 8000 1 significant figures 1000 7500 x < 8500 8 1 significant figures 1 7.5 x < 8.5 0.8 1 significant figures 0.1 0.75 x < 0.85 3.8 2 significant figures 0.1 3.75 x < 3.85 3.7 2 significant figures 0.1 3.65 x < 3.75 13.7 3 significant figures 0.1 13.65 x < 13.75 1.37 3 significant figures 0.01 1.365 x < 1.375 1.38 3 significant figures 0.01 1.375 x < 1.385