Visual Analysis: Decisions, Batman's Graphs, COVID Tests, and Flattening the Curve
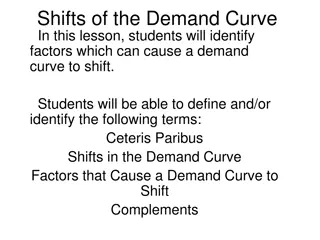
Explore a collection of images featuring Mythbusters, Batman's original and corrected graphs, alternative Batman heights and weights, COVID tests graph, and a depiction of flattening the curve. Each image provides insight into decision-making, data representation, and visual storytelling. Learn how misleading graphs can impact perceptions about COVID-19 data and see how Russian TV utilized a graph to illustrate the concept of flattening the curve. Dive into intriguing visuals that showcase different aspects of analysis and information presentation.

Download Presentation

Please find below an Image/Link to download the presentation.
The content on the website is provided AS IS for your information and personal use only. It may not be sold, licensed, or shared on other websites without obtaining consent from the author. Download presentation by click this link. If you encounter any issues during the download, it is possible that the publisher has removed the file from their server.
E N D
Presentation Transcript
Mythbusters Making decisions
Batman corrected graph 3
Batman alternative graph Bruce Gain - estimated heights and weights of on-screen Batman 250 200 150 100 50 0 Comic Book Adam West Michael Keaton Val Kilmer George Clooney Christian Bale Lego Batman Ben Affleck Height Weight 4
COVID tests graph Figure 3: https://towardsdatascience.com/stopping-covid-19-with-misleading-graphs-6812a61a57c9 5
Flattening of thecurve Russian TV used this graph to illustrate a flattening of the curve 2337 1836 1534 1264 1036 840 658 495 438 Case numbers 367 306 253 199 147 114 93 63 59 45 34 28 20 17 14 11 7 1 5 6 7 8 9 10 11 12 13 14 15 16 17 18 19 20 21 22 23 24 25 26 27 28 29 30 31 Date in March Figure 4: https://towardsdatascience.com/stopping-covid-19-with-misleading-graphs-6812a61a57c9 6
Counties cases over the past 15 day Figure 5: https://towardsdatascience.com/stopping-covid-19-with-misleading-graphs-6812a61a57c9 7