Understanding Strength-Duration (SD) Curve: A Neuromuscular Diagnostic Test

Strength-Duration (SD) curve is a diagnostic test assessing neuromuscular integrity by measuring the relationship between stimulus strength and duration. It helps in electro-diagnosis of peripheral nervous system disorders and evaluates nerve degeneration and regeneration. The curve is obtained by plotting stimulus strength and duration, with important points like Rheobase, Utilization Time, and Chronaxie defining excitability properties. Chronaxie, particularly important for tissue excitability assessment, varies across tissues and stages of life. Understanding these concepts is crucial for clinical evaluation and treatment planning.
- Neuromuscular Junction
- Excitability Curve
- Electrodiagnosis
- Peripheral Nervous System
- Chronaxie Measurement

Download Presentation

Please find below an Image/Link to download the presentation.
The content on the website is provided AS IS for your information and personal use only. It may not be sold, licensed, or shared on other websites without obtaining consent from the author. Download presentation by click this link. If you encounter any issues during the download, it is possible that the publisher has removed the file from their server.
E N D
Presentation Transcript
Strength Duration(SD) Curve
Strength- duration(I /t) curve It is the test of neuromuscular junction,and irritability of the muscle. This diagnostic test is presented in I /t. It is also known as excitability curve. Excitability Curve is the graph that demonstrates the exact relationship between the strength and the duration of the stimulus. This I /t or strength- duration curve are widely used for electro- diagnosis of peripheral nervous system disorders. This test provide reliable means of assessing the location, severity & progress of peripheral motor- nerve degeneration & regeneration. The S- D curve has the limitation of providing data to evaluate neuromuscular integrity only in the local fibres that respond to the stimulus. This limitation can only be overcome by testing several muscles in the innervated by the nerve of interest.
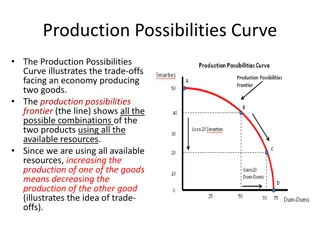
METHOD TO OBTAIN THE CURVE Strength- duration Curve. R= Rheobase, UT= Utilization time, C= Chronaxie.
In this curve,the strength of the stimulus is plotted (in volts) vertically and the duration (in milliseconds) horizontally. To start with, a stimulus with higher strength or voltage ( 4 or 5 volt) is applied.The minimum duration,taken by the stimulus with particular strength to excite the tissue is noted. The strength and duration are plotted in graph,. Then, the strength of the stimulus is decreased and the duration is determined. Like this, the voltage is decreased gradually and the duration is determined every time. All the results are plotted and the curve is obtained.
Characteristic features of the curve The shape of the curve is similar in almost all the excitable tissues. Following are the important points to be observed in the excitability curve: 1. Rheobase 2. Utilization time 3. Chronaxie Rheobase It is the minimum strength of stimulus, which can excite the tissue. The voltage below this cannot excite the tissue, whatever may be the duration of the stimulus. Utilization time It is the minimum time required for rheobasic strength of stimulus threshold strength to excite the tissue. Chronaxie it is the minimum time required for a stimulus with double the rheobasic strength ( voltage ) to excite the tissue.
Importance of chronaxie Measurement of chronaxie determines the excitability of the tissues. It is used to compare the excitability in different tissues. Longer the chronaxie,lesser is the excitability. Normal Chronaxie In human skeletal muscles : 0.08 to 0.32 milliseconds. In frog skeletal muscle : 3 milliseconds.
Variation in chronaxie Chronaxie is : Ten times more in skeletal muscles of infants than in the skeletal muscle of adults. Shorter in red muscles than in pale muscles. Shorter in warm- blooded (homeothermic) animals than in cold- blooded (poikilothermic) animals. Shortened during increased temperature and prolonged during cold temperature. Longer in paralyzed muscles than in normal muscle. Prolonged gradually during progressive neural diseases. 1. 2. 3. 4. 5. 6.
Characteristics Feature of S- D Curve Normal /Complete Innervation :-
Normal / Complete innervation Complete means whole and innervation means to supply with nerves thus, complete innervation means when all nerve fibres supplying a muscles are intact and functional. The graph plotted is lower, flatter and gradually shifts to the left. The curve is of typical shape because the same strength of stimulus is required to produce a response with all the impulses of large duration. Shorter duration require an increase in the strength of stimulus each time the duration is reduced. The point at which curve begins to rise is variable but usually around 1 millisecond. In this graph, Rheobase = 2 mA Chronaxie = 3 ms
Complete Denervation When all nerve fibres supplying a muscle have degenerated, the condition is known as complete denervation. The curve rises steeply and shift to the right. For all the impulses, eith the duration of 300 ms or less, the strength of stimulus must be increased each time the duration is reduced. No response is obtained to the impulses of very short duration. Thus, the curve rises steeply and further to right than that of normal innervation. In the graph, Rheobase = 4mA Chronaxie = 30ms
Partial Denervation:- When some of the nerve fibers supplying the muscles are degenerated while the others are intact is known to be as Partial Denervation.
Shape of the curve When the impulses are of shorter , the dennervated fibers respond less readily and curve rises steeply like that of a dennervated muscle . With the impulses of shorter duration , the innervated fibers respond to a weaker stimulus and this part of the nerve is similar to that of a curve formed in innervated muscle .
Thus , the right hand part of the curve resembles that of dennervated muscle and left hand part of curve resembles that of innervated muscle
A KINK is seen at the point where these two sections meet .
RHEOBASE 5 mA CHRONAXIE 10 mS
")
 curve")