Revisiting Adjustor Curves for Total Phosphorus Removal Rates
Based on a literature review, it was found that a 5th-order polynomial curve is a better fit than the originally used logarithmic trendline for anchor rates of percent Total Phosphorus removal related to runoff depth. The expert panel report reflects the old curves while trendline equations in FAQ documents show the new polynomial curve. A decision is needed on which curve to use going forward for consistency in guidance distribution. Urban BMP factsheets cover various topics related to Chesapeake Bay pollutant reduction plans, stormwater management, and more.

Download Presentation

Please find below an Image/Link to download the presentation.
The content on the website is provided AS IS for your information and personal use only. It may not be sold, licensed, or shared on other websites without obtaining consent from the author. Download presentation by click this link. If you encounter any issues during the download, it is possible that the publisher has removed the file from their server.
E N D
Presentation Transcript
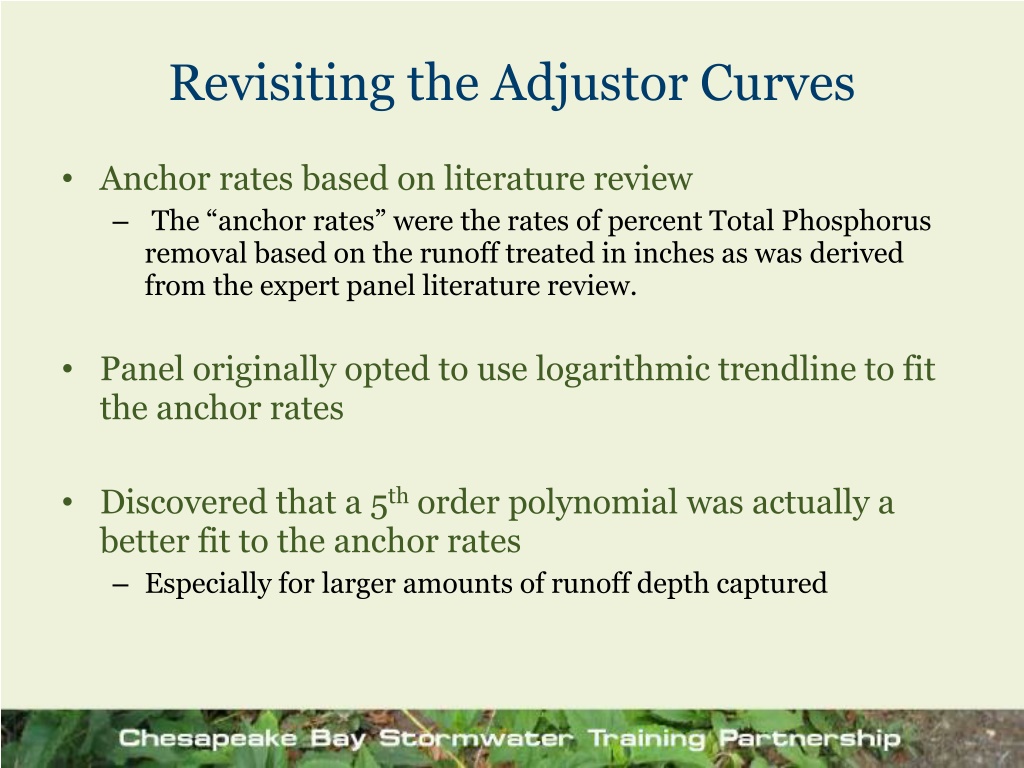
Revisiting the Adjustor Curves Anchor rates based on literature review The anchor rates were the rates of percent Total Phosphorus removal based on the runoff treated in inches as was derived from the expert panel literature review. Panel originally opted to use logarithmic trendline to fit the anchor rates Discovered that a 5thorder polynomial was actually a better fit to the anchor rates Especially for larger amounts of runoff depth captured
So?? Expert Panel report still reflects the log curve Trendline equations in the FAQ document reflect the polynomial curve Several state guidance documents use the curves from the panel report which reflects the old curves (log)
Next Steps Recommend USWG makes a decision on which curves to use going forward Need for consistency in the guidance being distributed Implications: Logarithmic: changes to the trendline equations in the FAQ document (and some associated training materials) Polynomial: the expert panel report should be revised to reflect Model currently uses polynomial curves; if changed to log could not be reflected until 2015
Fact Sheet Topics 1. Basics of Ches Bay Pollutant Reduction Plans 2. Stormwater Retrofits 3. Stormwater Practices for New and Redevelopment Projects 4. Stream Restoration 5. Urban Nutrient Management 6. Erosion and Sediment Control 7. Residential BMPs (i.e. homeowner) 8. Septic Systems 9. Urban Filter Strips
Fact Sheet Contents Practice Description Best Places to Implement Them in Your Community How to Find & Rank Candidate Sites General Cost Estimation What Technical Support is Needed Brief Summary of How to Compute Credits Add l Community Benefits Provided What to Report to State/Local Records to Keep How to Verify Practice in Future State Specific Info and contacts