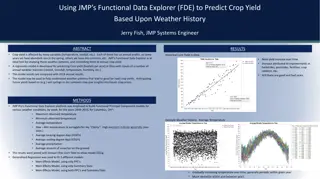
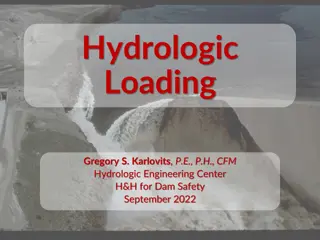
Practical Guide to Drawing Long-Term Yield Curve at Krugersdrift Dam
Learn how to draw a long-term yield curve at Krugersdrift Dam step-by-step, including setting up the study, browsing for data, importing hydrology files, manipulating the curve for accuracy, and achieving the final result.

Download Presentation

Please find below an Image/Link to download the presentation.
The content on the website is provided AS IS for your information and personal use only. It may not be sold, licensed, or shared on other websites without obtaining consent from the author. Download presentation by click this link. If you encounter any issues during the download, it is possible that the publisher has removed the file from their server.
E N D
Presentation Transcript
Practical: Drawing a Long Term Yield Curve: Krugersdrift Dam
Practical data onto computers Copy practical krug into C:\WRYM\ folder
Set up study Open WRMF Study Selection screen Select New tab Complete as indicated
On Yield model tab Browse for wrym.dat in C:\WRYM\KRUG\RUN\ Open Save Highlight LTPRACTICAL Click OK Click close
Unclick import hydrology files Ok with error message Go to tab YRC This stands for Yield Reliability Curves Load chart data from file: blue square icon Long term curve will load Include assurance lines 1 in 20, 50, 100, 200 Note no target draft on left hand of 1 in 20 years Load chart data from file again Yes to combine 2 sum.outs Browse to add sum.out1 Add TDs 26, 28, 30, remove TD 24 Load chart data from file again Yes to combine 2 sum.outs Browse to add sum.out2 Add TD 33 Note all assurances have TD on left and right of line
Manipulating curve Zoom into right hand side where curve ends Base yield lines should not cross each other Click on curve to adjust, curve will go bold Right click, select when X = 100%, Y = ? Edit Y value to move curve to not cross others