Understanding Kinematics Graphs in Physics

Explore the concepts of kinematics graphs through diagrams and descriptions. Learn to interpret distance-time, velocity-time, and speed-time graphs. Understand key parameters such as displacement, initial velocity, final velocity, constant acceleration, and time spent on different parts of a journey. Practice analyzing graphs of car journeys and calculating gradients and areas under the curves. Delve into scenarios involving acceleration, deceleration, and speed restrictions, enhancing your grasp of kinematics principles.

Download Presentation

Please find below an Image/Link to download the presentation.
The content on the website is provided AS IS for your information and personal use only. It may not be sold, licensed, or shared on other websites without obtaining consent from the author. Download presentation by click this link. If you encounter any issues during the download, it is possible that the publisher has removed the file from their server.
E N D
Presentation Transcript
Kinematics Graphs
KUS objectives BAT Draw accurate diagrams for distance-time and velocity time graphs BAT Find Area under a speed-time graph, gradient of a speed-time graph WB15 working in pairs describe each of the following graphs S displacement (distance travelled from a start point) U initial velocity V final velocity A constant acceleration T time spent on this section of a journey a journey can be split into several sections, each of which has constant acceleration
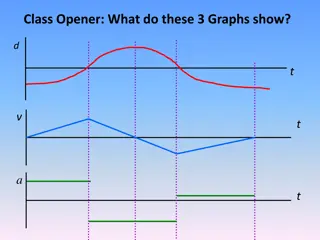
STARTER DESCRIBE THIS GRAPH (i) WB 15 Graph of a car journey Describe each of s u v a t s (m) 10 5 10 5 t (secs)
STARTER DESCRIBE THIS GRAPH (ii) WB 15 Graph of a car journey Describe each of s u v a t v (ms-1) 10 5 10 5 t (secs)
STARTER DESCRIBE THIS GRAPH (iii) WB 15 Graph of a car journey Describe each of s u v a t a(ms-2) 15 10 5 - 5 -10 10 5 15 t (secs)
WB16 Velocity time graph v (ms-1) 14 5 12 t (secs) What can we work out from this graph?
WB16 Velocity time graph v (ms-1) 14 5 12 t (secs) Gradient ???????????? =?????? ?? ???????? ?????? ?? ???? ? =?? ? =? ? ?? ? ??
WB16 Velocity time graph v (ms-1) 14 5 12 t (secs) Distance travelled ???????????? = ???? ????? ????? ? = ? ?? +? ??? ? ?? = ??? ?
WB 17 A car travels along a straight horizontal road on which there are some roadwork's with a speed restriction in force. The brakes are applied for 5s on the approach to the roadwork's, reducing the car s speed from 28ms-1 to 22ms-1. The brakes are released and the car continues at a constant speed of 22ms-1 for a further 10 seconds. Sketch the speed time graph for this problem a) Explain how the speed-time graph shows when the brakes are applied the car undergoes a constant deceleration. b) Calculate the car s deceleration in the first 5 seconds of the motion
WB 17 Combining graphs and equations 28 v(ms-1) 22 5 15 t(s) a) Explain how the velocity-time graph shows when the brakes are applied the car undergoes a constant deceleration. a straight line decrease in speed means the rate of change of velocity is constant
WB 17 Combining graphs and equations 28 v(ms-1) 22 5 15 t(s) b) Calculate the car s deceleration in the first 5 seconds of the motion ? =? ? 28 22 5 = 1.2 ?? 2this is the gradient of the v-t graph ? =
WB 17 Hint this journey is in two parts Use s=ut + at2 for each part v(ms-1) Combining graphs and equations 28 22 t(s) 5 15 c) Find the total distance covered by the car during the 15 seconds 1st part of journey ? = 22 5 + ( 1.2) 52 = 125 ? + 2nd part of journey ? = 22 10 = 220 This makes 345 m in total. This is the same as the area under the graph
WB 17 Combining graphs and equations 28 v(ms-1) 22 5 15 t(s) d) What is the car s average speed during the 15 seconds? average speed = ????? ???????? ????? ????= 345 15 = 23 ?? 1
WB 18 A cyclist travels on a straight road over a 11 s period. For the first four seconds they travel at constant speed of 8 ms-1 For the rest of the time they accelerate at a constant rate of 1 ms-2 Draw a Velocity time graph of their journey and work out the distance they have travelled v(ms-1) V 8 4 11 t(s)
WB 18 solution A cyclist travels on a straight road over a 11 s period. For the first four seconds they travel at constant speed of 8 ms-1 For the rest of the time they accelerate at a constant rate of 1 ms-2 Draw a Velocity time graph of their journey and work out the distance they have travelled v(ms-1) 8 4 11 t(s) First find their final velocity S U 8 V A 1 T 7 V = u + at From t = 4 to t = 11 V = 8 + 1 x 7 = 15 ms-1 Next: the total distance travelled is the area under the graph
A man is jogging along a straight road at a constant speed of WB 19 4ms-1. He passes a friend with a bicycle who is standing at the side of the road and 20s later cycles to catch him up. The cyclist accelerates at a constant rate of 3 ms-2 until he reaches a speed of 12 ms-1 . He then maintains a constant speed. a) On the same diagram sketch the speed-time graphs of both cyclist and jogger b) Find the time that elapses before the cyclist meets the jogger
WB 19 solution Let t = 0 at start Let t = T when they meet v (ms-1) Cyclist and jogger answers (a) 10 5 T 20 t (secs)
v (ms-1) WB 19 solution The jogger and cyclist will meet when they have gone the same distance Cyclist and jogger answers (b) 10 5 Distance travelled by jogger = 4T 24 20 T t (secs) Cyclist takes 4 secs to go from 0 to 12 ms-1 so reaches 12 ms-1 at time 24 secs Distance travelled by cyclist = (24 - 20) x 12 + (T - 24) x 12 = 4T 24 + 12T 288 = 4T T = 33 secs
WB 20 Two trains M and N are moving in the same direction along parallel straight horizontal tracks. At time t=0, M overtakes N whilst they are travelling with speeds 40 ms-1 and 30 ms-1 respectively. Train M overtakes train N as they pass a point X at the side of the tracks. . After overtaking N, train M maintains its speed of 40 ms-1 for T seconds and then decelerates uniformly to rest next to a point Y on the tracks After being overtaken, train N maintains its speed of 30 ms-1 for 25 seconds and then decelerates uniformly, also coming to rest next to point Y The times taken by the trains to travel between X and Y are the same a) Sketch, on the same diagram v-t graphs for both trains between X and Y [4] b) Given that XY = 975 m, find the value of T [8]
WB 20 solution v (ms-1) 40 M N Two Trucks answers 30 20 10 0 T 25 ?? t (secs)
v (ms- 40 WB 20 solution M 1) N 30 20 10 Two Trucks answers 0 T 25 ?? t secs Train N distance travelled AREA = 25 30 +1 2?? 25 30 = 975 Solves to ??= 43 Train M distance travelled AREA = ? 40 +1 243 ? (40) = 975 Solves to ? =33 4= 8.75
WB 21 acceleration graph a(ms-2) 4 2 0 -2 - 4 -6 -8 2 4 1 3 t (secs) The acceleration-time graph models the motion of a particle. At time t = 0 the particle has a velocity of 8 ms-1 in the positive direction a) Find the velocity of the particle when t = 2 b) At what time is the particle travelling in the negative direction?
WB 21 acceleration graph solution a) Find the velocity of the particle when t = 2 b) At what time does the particle start travelling in the negative direction? ?) ? = ? + ?? ? = 8 + 4 2 = 16 ?? 1 b) We want when the Velocity goes down to zero from 16 ?? 1 ? = ? + ?? 0 = 16 + 6 ? ? =16 6= 2.7 ???? So time after starting point is 2 + 2.7 = 4.7 ????
Velocity time graph WB 22 proof v (ms-1) V U 3 T t (secs) A particle travels as shown on the graph Given initial velocity ? = ? ?? ?and constant acceleration ? = ?.? ?? ? And without directly using the suvat equations Show that the distance travelled D is given by ? =1 4? 3 4? + 3? 9
Velocity time graph WB 22 solution v (ms-1) V U 3 T t (secs) Gradient =? ? So ? ? =3 2(? 3) ? 3= 1.5 Area under graph = ? ? 3 +1 2? ? (? 3) = ? ? 3 +1 2 3 2(? 3)(? 3) =1 44? ? 3 + 3 (? 3)(? 3) =1 4? 3 4? + 3 ? 9)
WB 23 k Speed (ms-1) 10 20 35 40 Time (s) The speed-time graph above illustrates part of a car s journey a) Find the magnitude of the car s final deceleration Given that the car travels 540 metres during this part of its journey (from t = 0 to t = 40) b) Find the value of k.
WB 23 solution k The speed-time graph above illustrates part of a car s journey a) Find the magnitude of the car s final deceleration Speed (ms-1) 10 Given that the car travels 540 metres during this part of its journey (from t = 0 to t = 40) b) Find the value of k. 20 35 40 a) v = u + at) Time (s) a =0 10 = 2 so the magnitude of deceleration is 2 ms-2 5 10+? 2 1 210 5 = 540 b) Area under graph = 20k + 15 + 20k + 75 + 7.5? + 25 = 540 ? = 16 ?? 1
WB 24 The acceleration-time graph shown represents part of a journey made by a car along a straight horizontal road. The car accelerated from rest at time t = 0 a) Find the distance travelled by the car during the first 4s of its journey. b) Find the total distance travelled by the car during the first 26s of its journey
WB 24 Solution Velocity First sketch a velocity time graph a) 1st part of journey S = s U = 0 V = A = 3 T = 4 ? = ?? +1 2??2 4 24 26 Time (s) ? = 0 +1 23 16 = 24 ?? 1 b) 1st part of journey b) 2nd part of journey S = 24 U = 0 V = A = 3 T = 4 ? = ? + ?? S = s U = 12 V = A = 1.5 T = 20 ? = ?? +1 2??2 ? = 0 + 3 4 ? = 12 ?? 1 ? = 12 20 +1 21.5 400 ? = 540 ?
WB 24 Solution Velocity First sketch a velocity time graph b) 2nd part of journey 4 24 26 S = 540 U = 12 V = A = 1.5 T = 20 ? = ? + ?? Time (s) ? = 12 + 1.5 20 ? = 42 ?? 1 b) 3rd part of journey S = s U = 42 V = (34) A = -4 T = 2 ? = ?? +1 2??2 ? = 42 2 +1 2 4 4 ? = 76 ? So total distance is 24 + 540 + 76 = 640 m
Summary Notes On a Displacement time graph: Velocity is the gradient On a Velocity time graph: Distance is the area under the graph On a Velocity time graph: Acceleration is the gradient Also On an Acceleration time graph: Velocity is the area under the graph Note: ???????? =? ???? ?? ???????? ? ???? ?? ???? =?? ?? ???????????? =? ???? ?? ???????? =?? ? ???? ?? ???? ??
KUS objectives BAT Draw accurate diagrams for distance-time and velocity time graphs BAT Find Area under a speed-time graph, gradient of a speed-time graph BAT Explore other graphs and links self-assess One thing learned is One thing to improve is


")
")
")


")