Understanding Basic Concepts in Statistics

This content covers fundamental concepts in statistics such as populations, samples, models, and probability distributions. It explains the differences between populations and samples, the importance of models in describing populations, and discusses various distributions like the normal and Poisson distributions. Additionally, it touches on introducing explanatory variables in models and categorizing them into discrete and continuous models with a small number of parameters.

Download Presentation

Please find below an Image/Link to download the presentation.
The content on the website is provided AS IS for your information and personal use only. It may not be sold, licensed, or shared on other websites without obtaining consent from the author. Download presentation by click this link. If you encounter any issues during the download, it is possible that the publisher has removed the file from their server.
E N D
Presentation Transcript
Statistics Basics Alyson Wilson agwilso2@ncsu.edu August 20, 2018
Populations and Samples Population (Big Who) Group of people we want information from. Generally, very large. Impractical or prohibitively expensive to talk to everyone Sample (Small Who) Smaller group of people from population. Group we get information from.
Whats a model? A model is a simple general description of a population For the univariate models we re looking at first, there are a couple of ways I often think about how they describe the population: Data generating mechanism Limit : Draw a larger and larger sample, make your bins for the histogram finer and finer, gets closer to the function . . . .
Normal Distribution 0.4 Normal( ) Mean s.d. 0.3 Density 0.2 0.1 0.0 -4 -2 0 2 4 1 1 2?2? ?2) ? ? = ? 2?exp(
Poisson Distribution Unimodal Center (mean ) Spread (s.d. ) Discrete (counts) Model Sample
Poisson X counts the number of occurrences across a specified interval. Poisson( ) P[X = x] = ? ??? ?! x = 0, 1, 2, 3, . . . .; > 0 E[X] = Var[X] =
Whats a model? When we introduce models that include explanatory variables, we often use those variables to model the parameters. For example, linear regression ? = ?0+ ?1??
More on Models The class of models we are considering are called probability distributions Much like data, it is useful to group these models into discrete and continuous The models are specified with a small number of parameters
More on Models To identify a particular model, we use its name and the parameter list Normal( , 2) Poisson( ) Exponential( ) Some models have one parameter, some two, some three, some a vector of length k
More on Models Each model also has two associated functions: the density (continuous) or mass (discrete) function and the cumulative distribution function. The density/mass function is the function that was plotted on the previous slides (e.g., the normal bell curve). The cumulative distribution function is calculated from the density/mass function using integration/summation.
Inference 1. We have a model for the population 2. The population model has parameters 3. We get a sample from the population 4. We use the sample to calculate estimates of the parameters 5. We associate uncertainty with the estimates of the parameters
Be sure to read the next 9 slides on discrete and continuous probability distributions.
Discrete Probability Distributions A probability mass function for a discrete random variable X that can take on possible values x1, x2, . . ., is a non-negative function f(x), with f(xi) giving the probability that X takes on the value xi. f(xi) 0 f(xi) = 1
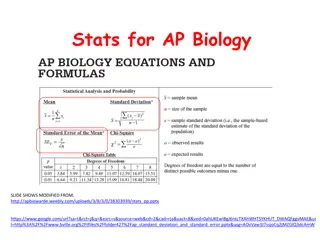
Expected Value The mean or expected value of a discrete random variable X is E[X] = x f(x)
Variance The variance of a discrete random variable X is Var[X] = (x E[X])2 f(x) = ( x2 f(x)) - E[X]2 The standard deviation of X is ???[?]
Cumulative Distribution Function Cumulative distribution function (cdf): F(x) for the discrete random variable X is defined as the probability that X is less than or equal to x F(x) = P[X x] = ? ?f(z)
Continuous Probability Distributions Probability density function f(x) 0 ? ? = 1 The intuition that we used for discrete random variables that the density function is the probability that X = x breaks down for continuous random variables. Why?
Continuous Probability Distributions Instead we can think about either the cumulative distribution function ? ? ? ? = ? ? = ? ? ?? or about the probability that X takes on a value in some interval (a,b) ? ? ? ? ? = ? ? ?? ?
Expected Value The mean or expected value of a continuous random variable X is ?? ? ?? E[X] = ?(?)? ? ?? E[g(X)] =
Variance The variance of a discrete random variable X is 2f x dx ? ? ? Var[X] = = ( = E[X2] E[X]2 x2 f(x) dx)- E[X]2 The standard deviation of X is ???[?]
Median The value x0 such that ?0 ? ? ?? = 0.5
Poisson X counts the number of occurrences across a specified interval. Poisson( ) P[X = x] = ? ??? ?! x = 0, 1, 2, 3, . . . .; > 0 E[X] = Var[X] =
Poisson Distribution Unimodal Center (mean ) Spread (s.d. ) Discrete (counts) Model Sample
Estimates The Poisson distribution has one parameter . is the mean or expected value of the Poisson distribution. We write E[X] = , where X is our notation for a single draw from the distribution.
Estimates Use R and draw a sample of size 100 from a Poisson distribution with parameter 5. Draw a barchart (hist()) of the sample. Calculate the mean and standard deviation of the sample. One simple way to estimate is to equate the sample mean to the population mean.
Method of Moments kth population moment: E[Xk] 1 n = k m x kth sample moment: k i If there are k parameters in the model, we will work with k (population, sample) moment pairs. We will set each pair equal and then solve the equations for the parameters.
Method of Moments Method of moments estimators equate sample moments to population moments. 1st population moment: E[X] 1st sample moment: m1 = 1 ? ?? 2nd population moment: E[X2] 1 n = 2 m x 2nd sample moment: 2 i
Estimating The Poisson( ) distribution has one parameter. E[X] = (population moment) m1 = 1 ? ?? (sample moment) E[X] = m1 our point estimate of is the sample mean. 1 ? ?? We write ? =
Estimates Use R and draw a 10,000 samples of size 100 from a Poisson distribution with parameter 5. Calculate the sample mean from each sample. Draw a histogram of the sample means. This is an illustration of sampling variability.
sm <- rep(0,10000) for (i in 1:10000) sm[i] <- mean(rpois(100,5)) hist(sm)
The Central Limit Theorem This is an illustration of a very general (and important) result known as the Central Limit Theorem. If we take a random sample, have independent samples, and we sample less than 10% of the population, then as our sample size gets large enough (more on the next slide), the distribution of the sample means is (approximately) normally distributed with mean equal to the population mean and standard deviation equal to the (population standard deviation)/(square root of the sample size).
How many samples? It depends on shape of population distribution Symmetric: 5-15 samples Skewed: > 25 samples, sometimes many more
How does this help us? We know that if we took lots of samples of size 100 and calculated ?, the distribution of the sample means would be normally distributed with mean and standard deviation = population standard deviation/10. Because of properties of the normal distribution, we know if we go out 2 (actually 1.96) standard deviations to either side of the mean, we will see 95% of the values.
We want to say something about the uncertainty in our estimate. 95% of the time, ? 1.96?.?.?. ? ? + 1.96?.?.?. 100 100 Problem: We don t know the population standard deviation.
Confidence Intervals Since we don t know the population standard deviation, we approximate it with the sample standard deviation. ? 1.96?.?.?. ? ? + 1.96?.?.?. 10 10 Rewriting the inequalities on each side ? 1.96?.?.?. ? ? + 1.96?.?.?. 10 10 This is called a 95% confidence interval.
Confidence Intervals lb <- rep(0,10000) sm <- rep(0,10000) ssd <- rep(0,10000) ub <- rep(0,10000) inc <- rep(0,10000) for (i in 1:10000) { x <- rpois(100,5) sm[i] <- mean(x) ssd[i] <- sd(x) lb[i] <- sm[i] - 1.96*ssd[i]/10 ub[i] <- sm[i] + 1.96*ssd[i]/10 if ((lb[i] <= 5) & ub[i] >= 5) inc[i] <- 1 } hist(sm) hist(ssd) hist(lb) hist(ub) sum(inc)/10000
Confidence Intervals Problem: When we do our analysis, we don t know whether or not our particular confidence interval contains the population parameter. What we can say is that 95% of samples this size (n) will produce confidence intervals that capture the true proportion parameter.
Estimation and Intervals There are lots of ways to calculate estimates and confidence intervals. Different estimates have different properties that we might want: Easy (possible!) to compute Unbiased: expected value of estimate equals population parameter Consistent: As the sample size goes to infinity, the difference between the estimate and the population value goes to zero. We want a confidence interval to have the correct coverage. If we say it is a 95% interval, it should contain the population value 95% of the time.
P-value We have a sample of data. (Assume n = 100 for this example.) We hypothesize that this data is a sample from a population that can be modeled as a Poisson( = 5). We compute the sample mean, which is the statistic we will use to test our hypothesis. We see that our sample mean is 5.7. What do we think about our hypothesis now?
P-value sm <- rep(0,10000) for (i in 1:10000) sm[i] <- mean(rpois(100,5)) hist(sm)
P-value If our hypothesis about the population is true, by the Central Limit Theorem, if we draw lots of samples and calculate sample means, they should look like draws from a Normal(5,sd = sqrt(5)/10 = 0.224). What s the probability we see a value of 5.7 or bigger?
P-value What s the probability we see a value of 5.7 or bigger? pnorm(5.7,5,0.224) = 0.999111 So the (one-sided) p-value is 1 0.999111 = 0.000889 A small p-value means that the test statistic is not very likely to occur if our hypothesis about the population parameter is correct.


")