Understanding Information and Data Flow Diagrams in Digital Systems
Explore the creation and utilization of Information Flow Diagrams (IFDs), Data Flow Diagrams (DFDs), and Flowcharts in digital systems. Learn how these visual representations illustrate the flow of information, data processing, and system interactions, aiding in effective planning and communication.

Download Presentation

Please find below an Image/Link to download the presentation.
The content on the website is provided AS IS for your information and personal use only. It may not be sold, licensed, or shared on other websites without obtaining consent from the author. Download presentation by click this link. If you encounter any issues during the download, it is possible that the publisher has removed the file from their server.
E N D
Presentation Transcript
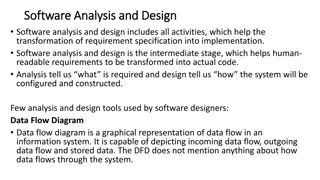
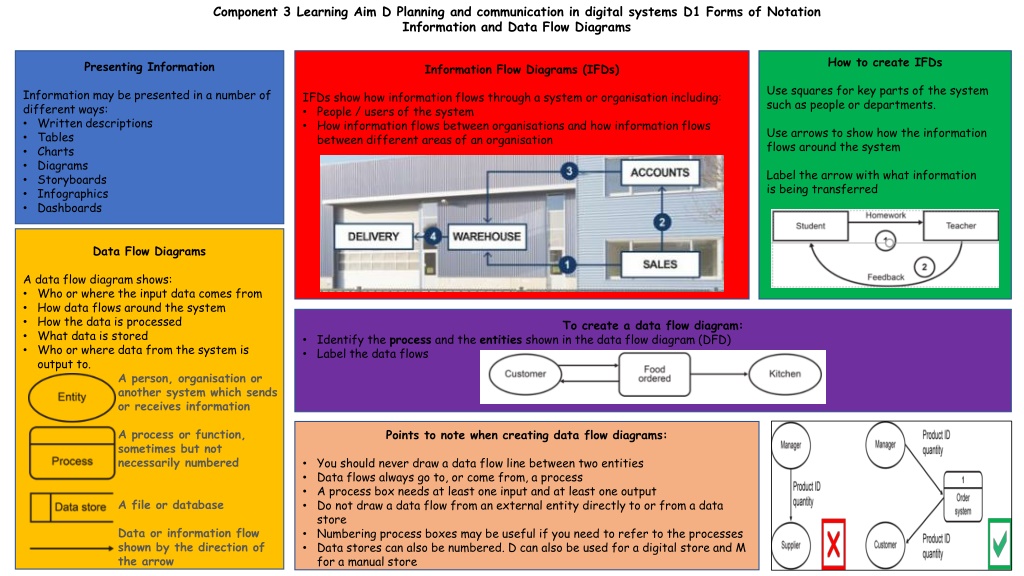
Component 3 Learning Aim D Planning and communication in digital systems D1 Forms of Notation Information and Data Flow Diagrams How to create IFDs Presenting Information Information Flow Diagrams (IFDs) Use squares for key parts of the system such as people or departments. Information may be presented in a number of different ways: Written descriptions Tables Charts Diagrams Storyboards Infographics Dashboards IFDs show how information flows through a system or organisation including: People / users of the system How information flows between organisations and how information flows between different areas of an organisation Use arrows to show how the information flows around the system Label the arrow with what information is being transferred Data Flow Diagrams A data flow diagram shows: Who or where the input data comes from How data flows around the system How the data is processed What data is stored Who or where data from the system is output to. A person, organisation or another system which sends or receives information To create a data flow diagram: Identify the process and the entities shown in the data flow diagram (DFD) Label the data flows A process or function, sometimes but not necessarily numbered Points to note when creating data flow diagrams: You should never draw a data flow line between two entities Data flows always go to, or come from, a process A process box needs at least one input and at least one output Do not draw a data flow from an external entity directly to or from a data store Numbering process boxes may be useful if you need to refer to the processes Data stores can also be numbered. D can also be used for a digital store and M for a manual store A file or database Data or information flow shown by the direction of the arrow
Component 3 Learning Aim D Planning and communication in digital systems D1 Forms of Notation Flowcharts Variables in a flow chart Flowchart Symbols Flowcharts Variables allow us to store a number or text in a flowchart A flowchart is often a clearer way to present the steps required Variables are often used in calculations Calculations will always be in a process box They are easy to understand They are less likely to be misunderstood than a list of text You can input or output what is stored in the variable Counting in a flow chart The statement count = count + 1 means Add 1 to the variable called count Real uses for flow charts Companies will often create flowcharts to show what to do when a problem occurs, such as: Fire procedures Customer complaints Manufacturing defects Companies may also have procedures to help employees to do their day to day work
Component 3 Learning Aim D Planning and communication in digital systems D1 Forms of Notation Systems Diagrams A Simple System Diagram Other uses for Systems Diagrams Computer Systems System diagrams can also be used for an organisation A computer system consists of all the hardware and software required to perform the required tasks System diagrams may use standard icons or be more informal At its simplest, a computer system consists of input, processing and output You may choose to just use boxes with text inside Drawing a systems diagram Most IT system diagrams will include: Hardware Input / output devices Storage devices / databases Network equipment such as Wi-Fi access points Computers / Smartphones / Tablets People involved in the system can also be included Processes or events are described Why use system diagrams? They can give a lot of information in a small space: Input and output devices Connections between components and data or signals Computers / servers involved Communication devices Feedback loops They are a good way to communicate designs, infrastructure and processes about IT and an organisation s systems They help in designing workable systems Step 1: Identify the key components Step 2: Draw the key parts Step 3: Connections Step 4: Label the diagram
Component 3 Learning Aim D Planning and communication in digital systems D1 Forms of Notation Tables and Written Information How to improve table design: Written information Tables Giving the table a title Referencing the source of the data Including units for the speed Considering what data the audience needs Use formatting features to help the reader: Conditional formatting makes it easier to see the difference in speeds Bold column titles are clearer Written information is good for giving further analysis of data. Tables are a useful way of presenting information How the data is presented in a table makes a difference to how easy it is to extract useful information Uses in business Policies Catalogues Reports Emails Letters Uses of tables: Timetabling Financial models Planning Survey results Flight departures / arrivals Rules on writing: Write concisely Use appropriate language for your audience Check your writing for spelling, punctuation and grammar Include references and acknowledgements Example Exam Question Disadvantage: A table may not be able to show all the required information For long documents or business reports: Include page numbers and a contents page Include a summary