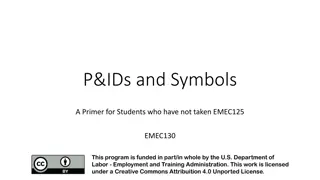
Comprehensive Guide to Loop Diagrams in Process Control Systems

Loop diagrams are essential documents in process control systems, depicting hydraulic, electric, magnetic, or pneumatic circuits. This comprehensive guide covers loop diagram definitions, components, guidelines, development stages, and instrument connection symbols. It explains what loop diagrams entail, their contents, and how to create them effectively.

Download Presentation

Please find below an Image/Link to download the presentation.
The content on the website is provided AS IS for your information and personal use only. It may not be sold, licensed, or shared on other websites without obtaining consent from the author. Download presentation by click this link. If you encounter any issues during the download, it is possible that the publisher has removed the file from their server.
E N D
Presentation Transcript
Loop Diagrams Chapter 07 Loop Diagrams EMEC125
Overview & Definitions Loop diagrams are the most popular of all the documents generated for a process control system. Definitions: Loop Diagram A schematic representation of a complete hydraulic, electric, magnetic, or pneumatic circuit. (International Society of Automation, 2003, p.299) Loop Instrumentation arranged as a combination of two or more instruments or functions arranged so that signals pass from one to another for the purpose of measurement and indication or control of a process variable. a) A self-contained device that measures and controls a process variable. (International Society of Automation, 2009, p.3.1.40)
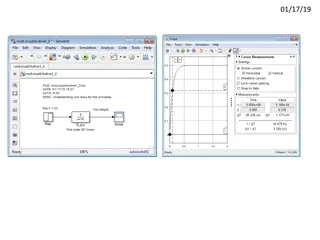
Sample Loop Diagram Loop_Diagram_Sample.pdf (CADtech Consultants, n.d.)
Loop Diagrams Whats On Them? Everything a controls technician needs to maintain and/or install a system of instrumentation Included is: Electrical and pneumatic signal connections Power connections to instruments and controls Indication and control devices, along with the connections to the process, to the piping, the ductwork, vessels, tanks, etc. Controllers whether computer or pneumatic Source and service utilities i.e. compressed air, water, electrical power, etc. Termination information that includes the identification of junction box(es), terminal strip numbers, terminal block numbers and possibly even pneumatic port numbers
Guidelines ISA-5.4-1991 Instrument Loop Diagrams spell out a few guidelines for creating loop diagrams. The standard states: Drawings should be American Society of Mechanical Engineers (ASME) B size (11 x 17 ) drawings. Only one loop should be depicted on a loop diagram. Paper can be portrait or landscape. Landscape is the preferred and is the most common orientation. Should be divided into sections that relate to component locations, such as and according to ISA-5.4: Field or Field Process Area Cable Spreading Room Computer I/O Cabinet/Cabinet Panel Front Control Panel Console
Developing a Loop Diagram Development can start when: A standard has been established as to the content. The P&IDs are completed and issued. Specification forms have been completed. All devices and instruments have been specified and preferably ordered. Junction boxes, if used, have been defined, a.k.a. marshalling panel. Termination diagrams for control computers are ready for loading.
Instrument Connections Symbols referenced in ISA-5.1 and ISA-5.4 apply for instrument loop diagrams. However, expansion of those symbols to include connection points, energy sources (electrical, air, hydraulic), and instrument action is necessary to provide the information required on instrument loop diagrams. (The Instrumentation, Systems, and Automation Society, 1991, p.12) Identify junction box or terminal assembly XXXX Instrument terminals or ports with identifying letters, numbers or both. (It is suggested that identifying numbers or letters be the manufacturer s designations) 1 2 3 4 5 6 7 8 15 16 FIC 1 2 Identify each connection used 103 Instrument terminals or ports General terminal or bulkhead symbol
Loop Diagram Energy Supply Electrical Power Supply Identify electrical power supply followed by the appropriate supply level identification and circuit number or disconnect identification L1 L2 G ES 115V, 60Hz Panel A, Circuit 12 TR 105 AS 20 PSIG (IA or PA are optional alternatives for air supply) Air Supply Identify air supply followed by air supply pressure TT 104 S Hydraulic fluid Supply Identify hydraulic fluid followed by the fluid supply pressure WT 103 S HS 50 PSIG
Instrument Action Identifies the response of the device to applied signals. The signals can be electronic or pneumatic. A transmitter and/or controller can provide two actions, direct or reverse: Direct Acting The output signal increases as the process variable (PV) increases. Reverse Acting The output signal decreases as the process variable (PV) increases. Loop diagram instruments should reference the action as direct or reverse. DIR can be used for direct and REV can be used for reverse.
Instrument Action Instruments REV LSH TC LT 104 104 104 REV DIR These instrument symbols show the control action by placing an acronym for the action near the instrument bubble. DIR identifies the instrument as Direct Acting and REV identifies the instrument as Reverse Acting. Because most transmitters are direct acting the DIR designation is optional and if not present the instrument can be assumed as direct acting.
P&ID Loop 100 PIC 100 PIT 100 PV 100 1" 10" 150 CS 004 10" 10" 6" 300 6 7 6"
Loop Diagram P-100 Field Process Area FROM 01-D-001 TRANSMITTER: MODEL NO: _________________ SPEC: NO: ___________________ 3 AS 20 PSIG CONTROLLER: MODEL NO: _________________ SPEC: NO: ___________________ 0-10 PSIG PIT 100 S O I PIC 100 O S 3-15 PSIG PIT-100-(B) AS 20 PSIG REV 10" 150 CS 004 ELEV 114'6" ELEV 119'0" 3-15 PSIG PV-100-(B) AS 100 PSIG I S O FO ELEV 120'0" PV 100 VALVE: MODEL NO: _________________ SPEC: NO: ___________________ TO FLARE REFERENCE DRAWINGS P&ID XXX INSTALLATION DETAILS NOTES: 1. PV-100 FULLY OPEN AT 3 PSIG FULLY CLOSED AT 15 PSIG
8 7 6 5 4 3 2 1 PLC 01 H H PLC 01 G G TT 01 TT 01 F F TE 01 TE 01 E E D D REVISIONS ZONE REV DESCRIPTION DATE APPROVED C C F4 02 Changed transducer from Air Products to Automation Direct Universal Mar. 3, 2012 F7 01 Modified wiring for Type K T/C Feb. 24, 2003 B B NCC PLC Training Panel Input Temperature Transducer/Transmitter Loop 01 A A SIZE B FSCM NO DWG NO REV 02 NCC145-04 None 1 OF 1 SCALE SHEET 8 7 6 5 4 3 2 1