Understanding Software Analysis and Design

S
o
f
t
w
a
r
e
A
n
a
l
y
s
i
s
a
n
d
D
e
s
i
g
n
•
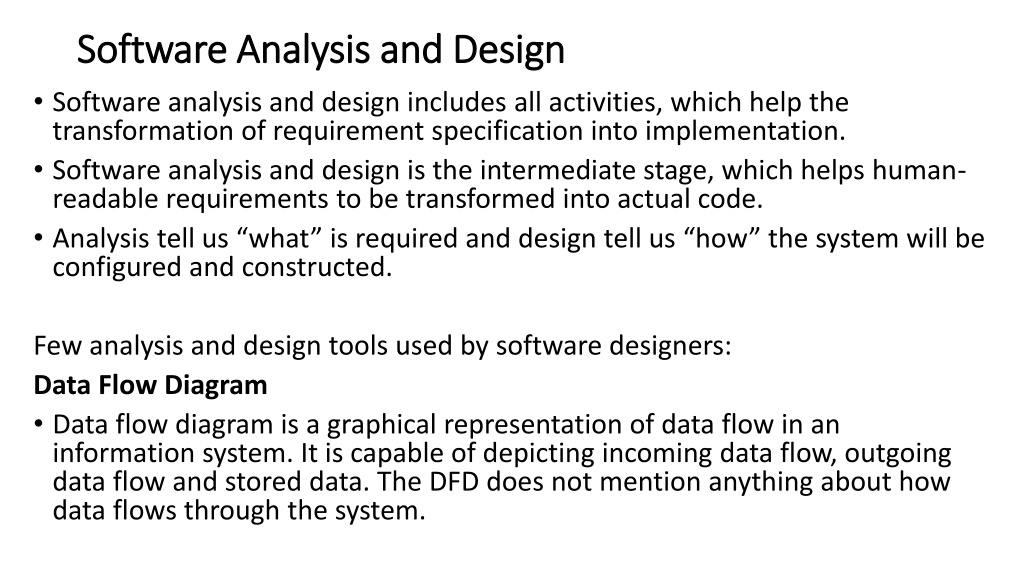
Software analysis and design includes all activities, which help the
transformation of requirement specification into implementation.
•
Software analysis and design is the intermediate stage, which helps human-
readable requirements to be transformed into actual code.
•
Analysis tell us “what” is required and design tell us “how” the system will be
configured and constructed.
Few analysis and design tools used by software designers:
Data Flow Diagram
•
Data flow diagram is a graphical representation of data flow in an
information system. It is capable of depicting incoming data flow, outgoing
data flow and stored data. The DFD does not mention anything about how
data flows through the system.
T
y
p
e
s
o
f
D
F
D
•
Data Flow Diagrams are either Logical or Physical.
•
Logical DFD
- This type of DFD concentrates on the system process and flow
of data in the system. For example in a Banking software system, how data is
moved between different entities.
•
Physical DFD
- This type of DFD shows how the data flow is actually
implemented in the system. It is more specific and close to the
implementation.
D
F
D
C
o
m
p
o
n
e
n
t
s
•
Entities
- Entities are source and destination of information data. Entities are represented
by rectangles with their respective names.
•
Process
- Activities and action taken on the data are represented by Circle or Round-
edged rectangles.
•
Data Storage
- There are two variants of data storage - it can either be represented as a
rectangle with absence of both smaller sides or as an open-sided rectangle with only one
side missing.
•
Data Flow
- Movement of data is shown by pointed arrows. Data movement is shown
from the base of arrow as its source towards head of the arrow as destination.
D
a
t
a
D
i
c
t
i
o
n
a
r
y
•
A data dictionary lists all data items appearing in the DFD model of a system.
•
The data items listed include all data flows and the contents of all data stores
appearing on the DFDs in the DFD model of a system.
•
A data dictionary lists the purpose of all data items and the definition of all
composite data items in terms of their component data items.
•
E.g. a data dictionary entry may represent that the data
grossPay
consists of the
components regularPay and overtimePay.
•
Importance of data dictionary
•
A data dictionary provides a standard terminology for all relevant data for use by the
engineers working in a project. A consistent vocabulary for data items is very
important, since in large projects different engineers of the project have a tendency to
use different terms to refer to the same data, which unnecessary causes confusion.
•
The data dictionary provides the analyst with a means to determine the definition of
different data structures in terms of their component elements.
T
w
o
L
e
v
e
l
s
o
f
D
e
s
i
g
n
•
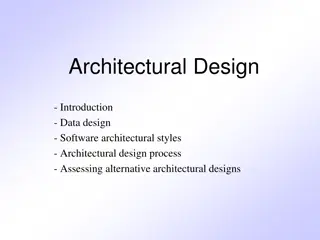
Architectural Design
•
Broad design of the overall system and structure
•
Also called General Design and Conceptual Design
•
Detailed Design
•
Low level design that includes the design of the specific program details
•
Design of each use case
•
Design of the database
•
Design of user and system interfaces
•
Design of controls and security
S
t
r
u
c
t
u
r
e
d
D
e
s
i
g
n
•
The aim of structured design is to transform the results of the structured
analysis (i.e. a DFD representation) into a structure chart. It provides two
strategies to guide transformation of a DFD into a structure chart:
•
Transform analysis
•
Transaction analysis
Structure Chart
•
A structure chart represents the software architecture, i.e. the various
modules making up the system, the dependency (which module calls which
other modules), and the parameters that are passed among the different
modules.
•
Hence, the structure chart representation can be easily implemented using some
programming language.
S
t
r
u
c
t
u
r
e
C
h
a
r
t
The basic building blocks which are used to design structure charts are the
following:
•
Rectangular boxes:
Represents a module.
•
Module invocation arrows:
Control is passed from on one module to
another module in the direction of the connecting arrow.
•
Data flow arrows:
Arrows are annotated with data name; named data passes
from one module to another module in the direction of the arrow.
•
Library modules:
Represented by a rectangle with double edges.
•
Selection:
Represented by a diamond symbol.
•
Repetition:
Represented by a loop around the control flow arrow.
S
t
r
u
c
t
u
r
e
d
C
h
a
r
t
:
P
r
o
b
l
e
m
S
o
l
v
i
n
g
*
S
t
r
u
c
t
u
r
e
d
C
h
a
r
t
f
o
r
a
P
a
y
r
o
l
l
S
y
s
t
e
m
T
r
a
n
s
f
o
r
m
A
n
a
l
y
s
i
s
•
Transform analysis identifies the primary functional components (modules) and the
high level inputs and outputs for these components.
•
The first step in transform analysis is to divide the DFD into 3 parts:
•
Input - includes processes that transform input data from physical (e.g. character from
terminal) to logical forms (e.g. internal tables, lists, etc.). Each input portion is called an
afferent branch.
•
Logical processing
•
Output – this transforms output data from logical to physical form. Each output portion is
called an efferent branch.
•
Second step of transform analysis - the structure chart is derived by drawing one
functional component for the
central transform
, and the
afferent
and
efferent
branches.
•
In the third step of transform analysis, the structure chart is refined by adding sub-
functions required by each of the high-level functional components.
•
Many levels of functional components may be added. This process of breaking functional
components into subcomponents is called factoring.
E
x
a
m
p
l
e
:
S
t
r
u
c
t
u
r
e
c
h
a
r
t
f
o
r
t
h
e
R
M
S
s
o
f
t
w
a
r
e
•
To draw the level 1 DFD: there are four basic functions that the system needs
to perform – accept the input numbers from the user, validate the numbers,
calculate the root mean square of the input numbers and, then display the
result.
Figure: Level 1 DFD
S
t
r
u
c
t
u
r
e
C
h
a
r
t
f
o
r
t
h
e
a
b
o
v
e
e
x
a
m
p
l
e
T
r
a
n
s
a
c
t
i
o
n
A
n
a
l
y
s
i
s
•
A transaction allows the user to perform some meaningful piece of work.
Transaction analysis is useful while designing transaction processing
programs.
•
In a transaction-driven system, one of several possible paths through the
DFD is traversed depending upon the input data item. This is in contrast to a
transform centered system which is characterized by similar processing steps
for each data item.
The structure chart for the supermarket prize scheme software
O
b
j
e
c
t
M
o
d
e
l
l
i
n
g
u
s
i
n
g
U
M
L
•
A model captures aspects important for some application while omitting (or
abstracting) the rest.
•
A model in the context of software development can be graphical, textual,
mathematical, or program code-based.
•
Models are very useful in documenting the design and analysis results -
models also facilitate the analysis and design procedures themselves.
•
Graphical models are very popular because they are easy to understand and
construct e.g. UML, however, it requires text explanations to accompany the
graphical models.
N
e
e
d
f
o
r
a
M
o
d
e
l
•
An important reason behind constructing a model is that it helps manage
complexity.
•
Also for other purposes during software development:
•
Analysis
•
Specification
•
Code generation
•
Design
•
Visualize and understand the problem and the working of a system
•
Testing, etc.
•
UML models can not only be used to document the results but also to arrive
at the results themselves.
•
A model developed for initial analysis and specification should be very
different from the one used for design.
U
n
i
f
i
e
d
M
o
d
e
l
i
n
g
L
a
n
g
u
a
g
e
(
U
M
L
)
•
It is used to visualize, specify, construct, and document the artifacts of a
software system.
•
It provides a set of notations (e.g. rectangles, lines, ellipses, etc.) to create a
visual model of the system.
•
Like any other language, UML has its own syntax (symbols and sentence
formation rules) and semantics (meanings of symbols and sentences).
•
Also, we should clearly understand that UML is not a system design or
development methodology, but can be used to document object-oriented
and analysis results obtained using some methodology.
O
r
i
g
i
n
o
f
U
M
L
•
UML was developed to standardize the large number of object-oriented modeling
notations that existed and were used extensively in the early 1990s. The principles
ones in use were:
•
Object Management Technology [Rumbaugh 1991]
•
Booch’s methodology [Booch 1991]
•
Object-Oriented Software Engineering [Jacobson 1992]
•
Odell’s methodology [Odell 1992]
•
Shaler and Mellor methodology [Shaler 1992]
•
UML was adopted by Object Management Group (OMG) as a
de facto
standard in
1997. OMG is an association of industries which tries to facilitate early formation
of standards.
•
UML contains an extensive set of notations and suggests construction of many
types of diagrams. It has successfully been used to model both large and small
problems.
•
The elegance of UML, its adoption by OMG, and a strong industry backing have
helped UML find widespread acceptance.
U
M
L
D
i
a
g
r
a
m
s
•
UML can be used to construct nine different types of diagrams to capture
five different views of a system. The different UML diagrams provide different
perspectives of the software system to be developed and facilitate a
comprehensive understanding of the system. Such models can be refined to
get the actual implementation of the system.
•
The UML diagrams can capture the following five views of a system
:
•
User’s view
•
Structural view
•
Behavioral view
•
Implementation view
•
Environmental view
U
M
L
D
i
a
g
r
a
m
s
•
User’s view:
This view defines the functionalities (facilities) made available
by the system to its users. The users’ view captures the external users’ view
of the system in terms of the functionalities offered by the system.
•
The users’ view is a black-box view of the system where the internal
structure, the dynamic behavior of different system components, the
implementation etc. are not visible.
•
The users’ view is very different from all other views in the sense that it is a
functional model compared to the object model of all other views.
•
The users’ view can be considered as the central view and all other views are
expected to conform to this view.
U
M
L
D
i
a
g
r
a
m
s
•
Structural view:
The structural view defines the kinds of objects (classes)
important to the understanding of the working of a system and to its
implementation.
•
It also captures the relationships among the classes (objects). The structural model is
also called the static model, since the structure of a system does not change with
time.
•
Behavioral view:
The behavioral view captures how objects interact with
each other to realize the system behavior. The system behavior captures the
time-dependent (dynamic) behavior of the system.
•
Implementation view:
This view captures the important components of the
system and their dependencies.
•
Environmental view:
This view models how the different components are
implemented on different pieces of hardware.
U
s
e
C
a
s
e
D
i
a
g
r
a
m
•
Use Case Model
•
The use case model for any system consists of a set of “use cases”. Intuitively,
use cases represent the different ways in which a system can be used by the
users.
•
E.g., to find all the use cases of a system, one can ask the question: “What
the users can do using the system?” Thus for the Library Information System
(LIS), the use cases could be
:
•
issue-book
•
query-book
•
return-book
•
create-member
•
add-book, etc
P
u
r
p
o
s
e
o
f
u
s
e
c
a
s
e
s
•
The purpose of a use case is to define a piece of coherent behavior without
revealing the internal structure of the system.
•
A use case typically represents a sequence of interactions between the user
and the system.
•
These interactions consist of one mainline sequence (represents the normal
interaction between a user and the system).
•
The mainline sequence is the most occurring sequence of interaction.
•
For example, the mainline sequence of the withdraw cash use case
supported by a bank
ATM drawn, complete the transaction, and get the
amount.
R
e
p
r
e
s
e
n
t
a
t
i
o
n
o
f
U
s
e
C
a
s
e
s
•
Use cases can be represented by drawing a use case diagram and writing an
accompanying text elaborating the drawing.
•
In the use case diagram, each use case is represented by an ellipse with the
name of the use case written inside the ellipse.
•
All the ellipses (i.e. use cases) of a system are enclosed within a rectangle
which represents the system boundary. The name of the system being
modeled (such as Library Information System) appears inside the rectangle.
•
The different users of the system are represented by using the stick person
icon. Each stick person icon is normally referred to as an actor.
•
An actor is a role played by a user with respect to the system use. It is
possible that the same user may play the role of multiple actors. Each actor
can participate in one or more use cases.
•
The line connecting the actor and the use case is called the communication
relationship.
U
s
e
c
a
s
e
E
x
a
m
p
l
e
–
T
i
c
-
T
a
c
-
T
o
e
C
o
m
p
u
t
e
r
G
a
m
e
•
Tic-tac-toe is a computer game in which a human player and the computer make
alternative moves on a 3×3 square. A move consists of marking previously unmarked
square. The player who first places three consecutive marks along a straight line on the
square (i.e. along a row, column, or diagonal) wins the game. As soon as either the human
player or the computer wins, a message congratulating the winner should be displayed. If
neither player manages to get three consecutive marks along a straight line, but all the
squares on the board are filled up, then the game is drawn.
T
e
x
t
D
e
s
c
r
i
p
t
i
o
n
•
Contact persons:
This section lists the personnel of the client organization with whom the use
case was discussed, date and time of the meeting, etc.
•
Actors:
In addition to identifying the actors, some information about actors using this use case
which may help the implementation of the use case may be recorded.
•
Pre-condition:
The preconditions would describe the state of the system before the use case
execution starts.
•
Post-condition:
This captures the state of the system after the use case has successfully
completed.
•
Non-functional requirements:
This could contain the important constraints for the design and
implementation, such as platform and environment conditions, qualitative statements, response
time requirements, etc.
•
Exceptions, error situations:
This contains only the domain-related errors such as lack of user’s
access rights, invalid entry in the input fields, etc. Obviously, errors that are not domain related,
such as software errors, need not be discussed here.
•
Sample dialogs:
These serve as examples illustrating the use case.
•
Specific user interface requirements:
These contain specific requirements for the user interface of
the use case. For example, it may contain forms to be used, screen shots, interaction style, etc.
•
Document references:
This part contains references to specific domain-related documents which
may be useful to understand the system operation
E
x
a
m
p
l
e
2
•
A supermarket needs to develop the following software to encourage regular
customers. For this, the customer needs to supply his/her residence address, telephone
number, and the driving license number. Each customer who registers for this scheme
is assigned a unique customer number (CN) by the computer. A customer can present
his CN to the checkout staff when he makes any purchase. In this case, the value of his
purchase is credited against his CN. At the end of each year, the supermarket intends to
award surprise gifts to 10 customers who make the highest total purchase over the
year. Also, it intends to award a 22 caret gold coin to every customer whose purchase
exceeded Rs.10,000. The entries against the CN are the reset on the day of every year
after the prize winners’ lists are generated.
T
h
e
u
s
e
c
a
s
e
m
o
d
e
l
f
o
r
t
h
e
S
u
p
e
r
m
a
r
k
e
t
P
r
i
z
e
S
c
h
e
m
e
T
e
x
t
d
e
s
c
r
i
p
t
i
o
n
f
o
r
“
r
e
g
i
s
t
e
r
-
c
u
s
t
o
m
e
r
”
U1:
register-customer: Using this use case, the customer can register himself by
providing the necessary details.
Scenario 1: Mainline sequence
1
.
Customer: select register customer option.
2. System: display prompt to enter name, address, and telephone number.
Customer: enter the necessary values.
3. System: display the generated id and the message that the customer has been
successfully registered.
Scenario 2:
at step 3 of mainline sequence
1. System: displays the message that the customer has already registered.
Scenario 3:
at step 3 of mainline sequence
1
.
System: displays the message that some input information has not been entered.
The system displays a prompt to enter the missing value.
The description for other use cases is written in a similar fashion.
F
a
c
t
o
r
i
n
g
o
f
u
s
e
c
a
s
e
s
•
It is often desirable to factor use cases into component use cases. Actually,
factoring of use cases are required under two situations.
•
First, complex use cases need to be factored into simpler use cases. This
would not only make the behavior associated with the use case much more
comprehensible, but also make the corresponding interaction diagrams more
tractable.
•
Secondly, use cases need to be factored whenever there is common behavior
across different use cases. Factoring would make it possible to define such
behavior only once and reuse it whenever required.
•
makes analysis of the class design much simpler and elegant.
F
a
c
t
o
r
i
n
g
o
f
u
s
e
c
a
s
e
s
•
UML offers three mechanisms for factoring of use cases as follows:
•
Generalization
•
Use case generalization can be used when one use case that is similar to another, but
does something slightly differently or something more. Like with classes, the child use
case inherits the behavior and meaning of the parent use case.
F
a
c
t
o
r
i
n
g
o
f
u
s
e
c
a
s
e
s
•
Includes
•
The
includes
relationship in the older versions of UML (prior to UML 1.1) was known
as the uses relationship. The
includes
relationship involves one use case including the
behavior of another use case in its sequence of events and actions. The
includes
relationship occurs when a chunk of behavior that is similar across a number of use
cases. The factoring of such behavior will help in not repeating the specification and
implementation across different use cases. Thus, the
includes
relationship explores
the issue of reuse by factoring out the commonality across use cases.
F
a
c
t
o
r
i
n
g
o
f
u
s
e
c
a
s
e
s
•
Extends
•
The main idea behind the
extends
relationship among the use cases is that it allows
you to show optional system behavior.
•
The
extends
relationship is similar to generalization. But unlike generalization, the
extending use case can add additional behavior only at an extension point only when
certain conditions are satisfied. The extension points are points within the use case
where variation to the mainline (normal) action sequence may occur. The
extends
relationship is normally used to capture alternate paths or scenarios.
Data flow diagram describes anything about how data flows through the system. It focuses on the flow of information, where data comes from, where it goes and how it get stored.
Difference between DFD and Flowchart: the flowchart depicts flow of control in program modules. DFDs depict flow of data in the system at various levels. DFD does not contain any control or branch elements.
Software analysis and design is an essential stage in the software development process, bridging requirements with implementation. It involves tools like Data Flow Diagrams (DFD) to depict data flow within a system. Types of DFD include Logical and Physical, each focusing on different aspects of data movement. DFD components include Entities, Processes, Data Storage, and Data Flow. A Data Dictionary lists all data items in the DFD model, providing a standardized terminology for engineers. Two levels of design, Architectural and Detailed, further refine the system structure and program specifics.

Download Presentation

Please find below an Image/Link to download the presentation.
The content on the website is provided AS IS for your information and personal use only. It may not be sold, licensed, or shared on other websites without obtaining consent from the author. Download presentation by click this link. If you encounter any issues during the download, it is possible that the publisher has removed the file from their server.
E N D
Presentation Transcript
Software Analysis and Design Software Analysis and Design Software analysis and design includes all activities, which help the transformation of requirement specification into implementation. Software analysis and design is the intermediate stage, which helps human- readable requirements to be transformed into actual code. Analysis tell us what is required and design tell us how the system will be configured and constructed. Few analysis and design tools used by software designers: Data Flow Diagram Data flow diagram is a graphical representation of data flow in an information system. It is capable of depicting incoming data flow, outgoing data flow and stored data. The DFD does not mention anything about how data flows through the system.
Types of DFD Types of DFD Data Flow Diagrams are either Logical or Physical. Logical DFD - This type of DFD concentrates on the system process and flow of data in the system. For example in a Banking software system, how data is moved between different entities. Physical DFD - This type of DFD shows how the data flow is actually implemented in the system. It is more specific and close to the implementation.
DFD Components DFD Components Entities - Entities are source and destination of information data. Entities are represented by rectangles with their respective names. Process - Activities and action taken on the data are represented by Circle or Round- edged rectangles. Data Storage - There are two variants of data storage - it can either be represented as a rectangle with absence of both smaller sides or as an open-sided rectangle with only one side missing. Data Flow - Movement of data is shown by pointed arrows. Data movement is shown from the base of arrow as its source towards head of the arrow as destination.
Data Dictionary Data Dictionary A data dictionary lists all data items appearing in the DFD model of a system. The data items listed include all data flows and the contents of all data stores appearing on the DFDs in the DFD model of a system. A data dictionary lists the purpose of all data items and the definition of all composite data items in terms of their component data items. E.g. a data dictionary entry may represent that the data grossPay consists of the components regularPay and overtimePay. Importance of data dictionary A data dictionary provides a standard terminology for all relevant data for use by the engineers working in a project. A consistent vocabulary for data items is very important, since in large projects different engineers of the project have a tendency to use different terms to refer to the same data, which unnecessary causes confusion. The data dictionary provides the analyst with a means to determine the definition of different data structures in terms of their component elements.
Two Levels of Design Two Levels of Design Architectural Design Broad design of the overall system and structure Also called General Design and Conceptual Design Detailed Design Low level design that includes the design of the specific program details Design of each use case Design of the database Design of user and system interfaces Design of controls and security
Structured Design Structured Design The aim of structured design is to transform the results of the structured analysis (i.e. a DFD representation) into a structure chart. It provides two strategies to guide transformation of a DFD into a structure chart: Transform analysis Transaction analysis Structure Chart A structure chart represents the software architecture, i.e. the various modules making up the system, the dependency (which module calls which other modules), and the parameters that are passed among the different modules. Hence, the structure chart representation can be easily implemented using some programming language.
Structure Chart Structure Chart The basic building blocks which are used to design structure charts are the following: Rectangular boxes: Represents a module. Module invocation arrows: Control is passed from on one module to another module in the direction of the connecting arrow. Data flow arrows: Arrows are annotated with data name; named data passes from one module to another module in the direction of the arrow. Library modules: Represented by a rectangle with double edges. Selection: Represented by a diamond symbol. Repetition: Represented by a loop around the control flow arrow.
Structured Chart: Problem Solving Structured Chart: Problem Solving
*Structured Chart for a Payroll System Structured Chart for a Payroll System
Transform Analysis Transform Analysis Transform analysis identifies the primary functional components (modules) and the high level inputs and outputs for these components. The first step in transform analysis is to divide the DFD into 3 parts: Input - includes processes that transform input data from physical (e.g. character from terminal) to logical forms (e.g. internal tables, lists, etc.). Each input portion is called an afferent branch. Logical processing Output this transforms output data from logical to physical form. Each output portion is called an efferent branch. Second step of transform analysis - the structure chart is derived by drawing one functional component for the central transform, and the afferent and efferent branches. In the third step of transform analysis, the structure chart is refined by adding sub- functions required by each of the high-level functional components. Many levels of functional components may be added. This process of breaking functional components into subcomponents is called factoring.
Example: Structure chart for the RMS software Example: Structure chart for the RMS software To draw the level 1 DFD: there are four basic functions that the system needs to perform accept the input numbers from the user, validate the numbers, calculate the root mean square of the input numbers and, then display the result. Figure: Level 1 DFD
Structure Chart for the above example Structure Chart for the above example
Transaction Analysis Transaction Analysis A transaction allows the user to perform some meaningful piece of work. Transaction analysis is useful while designing transaction processing programs. In a transaction-driven system, one of several possible paths through the DFD is traversed depending upon the input data item. This is in contrast to a transform centered system which is characterized by similar processing steps for each data item.
The structure chart for the supermarket prize scheme software
Object Modelling using UML Object Modelling using UML A model captures aspects important for some application while omitting (or abstracting) the rest. A model in the context of software development can be graphical, textual, mathematical, or program code-based. Models are very useful in documenting the design and analysis results - models also facilitate the analysis and design procedures themselves. Graphical models are very popular because they are easy to understand and construct e.g. UML, however, it requires text explanations to accompany the graphical models.
Need for a Model Need for a Model An important reason behind constructing a model is that it helps manage complexity. Also for other purposes during software development: Analysis Specification Code generation Design Visualize and understand the problem and the working of a system Testing, etc. UML models can not only be used to document the results but also to arrive at the results themselves. A model developed for initial analysis and specification should be very different from the one used for design.
Unified Modeling Language (UML) Unified Modeling Language (UML) It is used to visualize, specify, construct, and document the artifacts of a software system. It provides a set of notations (e.g. rectangles, lines, ellipses, etc.) to create a visual model of the system. Like any other language, UML has its own syntax (symbols and sentence formation rules) and semantics (meanings of symbols and sentences). Also, we should clearly understand that UML is not a system design or development methodology, but can be used to document object-oriented and analysis results obtained using some methodology.
Origin of UML Origin of UML UML was developed to standardize the large number of object-oriented modeling notations that existed and were used extensively in the early 1990s. The principles ones in use were: Object Management Technology [Rumbaugh 1991] Booch s methodology [Booch 1991] Object-Oriented Software Engineering [Jacobson 1992] Odell s methodology [Odell 1992] Shaler and Mellor methodology [Shaler 1992] UML was adopted by Object Management Group (OMG) as a de facto standard in 1997. OMG is an association of industries which tries to facilitate early formation of standards. UML contains an extensive set of notations and suggests construction of many types of diagrams. It has successfully been used to model both large and small problems. The elegance of UML, its adoption by OMG, and a strong industry backing have helped UML find widespread acceptance.
UML Diagrams UML Diagrams UML can be used to construct nine different types of diagrams to capture five different views of a system. The different UML diagrams provide different perspectives of the software system to be developed and facilitate a comprehensive understanding of the system. Such models can be refined to get the actual implementation of the system. The UML diagrams can capture the following five views of a system: User s view Structural view Behavioral view Implementation view Environmental view
UML Diagrams UML Diagrams User s view: This view defines the functionalities (facilities) made available by the system to its users. The users view captures the external users view of the system in terms of the functionalities offered by the system. The users view is a black-box view of the system where the internal structure, the dynamic behavior of different system components, the implementation etc. are not visible. The users view is very different from all other views in the sense that it is a functional model compared to the object model of all other views. The users view can be considered as the central view and all other views are expected to conform to this view.
UML Diagrams UML Diagrams Structural view: The structural view defines the kinds of objects (classes) important to the understanding of the working of a system and to its implementation. It also captures the relationships among the classes (objects). The structural model is also called the static model, since the structure of a system does not change with time. Behavioral view: The behavioral view captures how objects interact with each other to realize the system behavior. The system behavior captures the time-dependent (dynamic) behavior of the system. Implementation view: This view captures the important components of the system and their dependencies. Environmental view: This view models how the different components are implemented on different pieces of hardware.
Use Case Diagram Use Case Diagram Use Case Model The use case model for any system consists of a set of use cases . Intuitively, use cases represent the different ways in which a system can be used by the users. E.g., to find all the use cases of a system, one can ask the question: What the users can do using the system? Thus for the Library Information System (LIS), the use cases could be: issue-book query-book return-book create-member add-book, etc
Purpose of use cases Purpose of use cases The purpose of a use case is to define a piece of coherent behavior without revealing the internal structure of the system. A use case typically represents a sequence of interactions between the user and the system. These interactions consist of one mainline sequence (represents the normal interaction between a user and the system). The mainline sequence is the most occurring sequence of interaction. For example, the mainline sequence of the withdraw cash use case supported by a bank ATM drawn, complete the transaction, and get the amount.
Representation of Use Cases Representation of Use Cases Use cases can be represented by drawing a use case diagram and writing an accompanying text elaborating the drawing. In the use case diagram, each use case is represented by an ellipse with the name of the use case written inside the ellipse. All the ellipses (i.e. use cases) of a system are enclosed within a rectangle which represents the system boundary. The name of the system being modeled (such as Library Information System) appears inside the rectangle. The different users of the system are represented by using the stick person icon. Each stick person icon is normally referred to as an actor. An actor is a role played by a user with respect to the system use. It is possible that the same user may play the role of multiple actors. Each actor can participate in one or more use cases. The line connecting the actor and the use case is called the communication relationship.
Use case Example Use case Example Tic-Tac-Toe Computer Game Tic-tac-toe is a computer game in which a human player and the computer make alternative moves on a 3 3 square. A move consists of marking previously unmarked square. The player who first places three consecutive marks along a straight line on the square (i.e. along a row, column, or diagonal) wins the game. As soon as either the human player or the computer wins, a message congratulating the winner should be displayed. If neither player manages to get three consecutive marks along a straight line, but all the squares on the board are filled up, then the game is drawn.
Text Description Text Description Contact persons: This section lists the personnel of the client organization with whom the use case was discussed, date and time of the meeting, etc. Actors: In addition to identifying the actors, some information about actors using this use case which may help the implementation of the use case may be recorded. Pre-condition: The preconditions would describe the state of the system before the use case execution starts. Post-condition: This captures the state of the system after the use case has successfully completed. Non-functional requirements: This could contain the important constraints for the design and implementation, such as platform and environment conditions, qualitative statements, response time requirements, etc. Exceptions, error situations: This contains only the domain-related errors such as lack of user s access rights, invalid entry in the input fields, etc. Obviously, errors that are not domain related, such as software errors, need not be discussed here. Sample dialogs: These serve as examples illustrating the use case. Specific user interface requirements: These contain specific requirements for the user interface of the use case. For example, it may contain forms to be used, screen shots, interaction style, etc. Document references: This part contains references to specific domain-related documents which may be useful to understand the system operation
Example 2 Example 2 A supermarket needs to develop the following software to encourage regular customers. For this, the customer needs to supply his/her residence address, telephone number, and the driving license number. Each customer who registers for this scheme is assigned a unique customer number (CN) by the computer. A customer can present his CN to the checkout staff when he makes any purchase. In this case, the value of his purchase is credited against his CN. At the end of each year, the supermarket intends to award surprise gifts to 10 customers who make the highest total purchase over the year. Also, it intends to award a 22 caret gold coin to every customer whose purchase exceeded Rs.10,000. The entries against the CN are the reset on the day of every year after the prize winners lists are generated.
The use case model for the Supermarket Prize Scheme The use case model for the Supermarket Prize Scheme
Text description for register Text description for register- -customer customer U1: register-customer: Using this use case, the customer can register himself by providing the necessary details. Scenario 1: Mainline sequence 1. Customer: select register customer option. 2. System: display prompt to enter name, address, and telephone number. Customer: enter the necessary values. 3. System: display the generated id and the message that the customer has been successfully registered. Scenario 2: at step 3 of mainline sequence 1. System: displays the message that the customer has already registered. Scenario 3: at step 3 of mainline sequence 1. System: displays the message that some input information has not been entered. The system displays a prompt to enter the missing value. The description for other use cases is written in a similar fashion.
Factoring of use cases Factoring of use cases It is often desirable to factor use cases into component use cases. Actually, factoring of use cases are required under two situations. First, complex use cases need to be factored into simpler use cases. This would not only make the behavior associated with the use case much more comprehensible, but also make the corresponding interaction diagrams more tractable. Secondly, use cases need to be factored whenever there is common behavior across different use cases. Factoring would make it possible to define such behavior only once and reuse it whenever required. makes analysis of the class design much simpler and elegant.
Factoring of use cases Factoring of use cases UML offers three mechanisms for factoring of use cases as follows: Generalization Use case generalization can be used when one use case that is similar to another, but does something slightly differently or something more. Like with classes, the child use case inherits the behavior and meaning of the parent use case.
Factoring of use cases Factoring of use cases Includes The includes relationship in the older versions of UML (prior to UML 1.1) was known as the uses relationship. The includes relationship involves one use case including the behavior of another use case in its sequence of events and actions. The includes relationship occurs when a chunk of behavior that is similar across a number of use cases. The factoring of such behavior will help in not repeating the specification and implementation across different use cases. Thus, the includes relationship explores the issue of reuse by factoring out the commonality across use cases.
Factoring of use cases Factoring of use cases Extends The main idea behind the extends relationship among the use cases is that it allows you to show optional system behavior. The extends relationship is similar to generalization. But unlike generalization, the extending use case can add additional behavior only at an extension point only when certain conditions are satisfied. The extension points are points within the use case where variation to the mainline (normal) action sequence may occur. The extends relationship is normally used to capture alternate paths or scenarios.


")