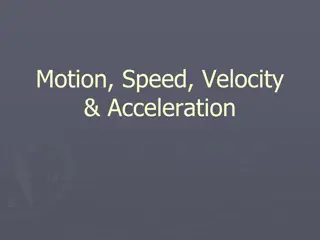
Understanding the Relationship Between Position, Velocity, and Acceleration Graphs
Gain intuition on how position, velocity, and acceleration are visually related through s-t, v-t, and a-t graphs. Discover how to interpret and draw accurate velocity vs. time plots based on position vs. time data. Learn the significance of comparing these charts and how they can be useful in various computational applications.

Download Presentation

Please find below an Image/Link to download the presentation.
The content on the website is provided AS IS for your information and personal use only. It may not be sold, licensed, or shared on other websites without obtaining consent from the author. Download presentation by click this link. If you encounter any issues during the download, it is possible that the publisher has removed the file from their server.
E N D
Presentation Transcript
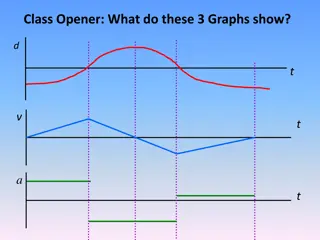
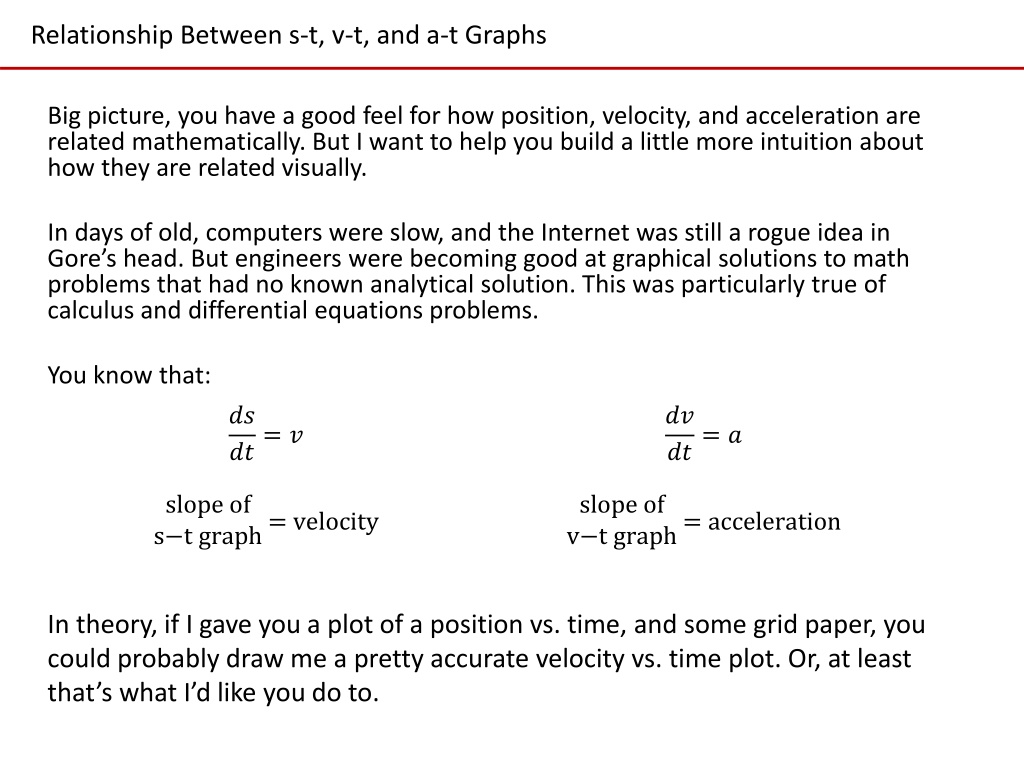
Relationship Between s-t, v-t, and a-t Graphs Big picture, you have a good feel for how position, velocity, and acceleration are related mathematically. But I want to help you build a little more intuition about how they are related visually. In days of old, computers were slow, and the Internet was still a rogue idea in Gore s head. But engineers were becoming good at graphical solutions to math problems that had no known analytical solution. This was particularly true of calculus and differential equations problems. You know that: ?? ??= ? ?? ??= ? slope of s t graph = velocity slope of v t graph = acceleration In theory, if I gave you a plot of a position vs. time, and some grid paper, you could probably draw me a pretty accurate velocity vs. time plot. Or, at least that s what I d like you do to.
Relationship Between s-t, v-t, and a-t Graphs But Dr. Dan ..why would we want to learn a skill like that? When would it ever be useful in modern times? - Imaginary Dynamics Student That s an excellent question, young grasshopper. The answer is: Outside of a Fluids Lab working problems on a napkin, you probably never will. But if you replace plot with data and grid paper with phenomenal (computational) power then the answer is: All the freaking time. Besides, this is a tool that also serves as another great way to check your (or someone else's) work. You should get so good at comparing these kind of charts that you can do it with very little mental effort.
12.3 Rectilinear Kinematics: Erratic Motion In many cases the position, velocity, and acceleration of a particle cannot be described by a continuous mathematical function along its entire path. The s-t and v-t graphs: ds dt= v slope of = velocity s-t graph
12.3 Rectilinear Kinematics: Erratic Motion In many cases the position, velocity, and acceleration of a particle cannot be described by a continuous mathematical function along its entire path. The v-t and a-t graphs: dv dt= a slope of = acceleration v-t graph
Relationship Between s-t, v-t, and a-t Graphs How about the other way? What if you have a plot of acceleration as a function of time? How to you get to velocity? Or position? You know that: = = v adt s vdt change in velocity area under a-t graph area under = displacement = v-t graph In theory, if I gave you a plot of acceleration vs. time, and some grid paper, you could probably draw me a pretty accurate velocity vs. time plot.
12.3 Rectilinear Kinematics: Erratic Motion In many cases the position, velocity, and acceleration of a particle cannot be described by a continuous mathematical function along its entire path. The a-t and v-t graphs: = v adt change in velocity area under a-t graph =
12.3 Rectilinear Kinematics: Erratic Motion In many cases the position, velocity, and acceleration of a particle cannot be described by a continuous mathematical function along its entire path. The v-t and s-t graphs: = s vdt area under displacement = v-t graph
Relationship Between s-t, v-t, and a-t Graphs Group Discussion: With those around you see if you can come to some agreement on the following scenerio: Suppose you wanted to know the position, velocity, and acceleration of an object as a function of time. You have a device that will record data (time stamped), but you can only choose one sensor. You can record position, velocity, or acceleration. What sensor would you choose, and why?
In-Class Practice Problem 1 What do you notice? Key words? How to you approach the problem? What do you predict about the answer? What are the units for velocity and acceleration going to be?
In-Class Practice Problem 1 Mathy Solution
In-Class Practice Problem 1 Napkin Solution
In-Class Practice Problem 2 What do you notice? Key words? How to you approach the problem? How big are these accelerations? What can you compare them with? What do you predict about the answer? What are the units for velocity and position going to be?
In-Class Practice Problem 3 What do you notice? Key words? How to you approach the problem? How fast is 15 m/s in mph? Is this something a mid 80 s to early 90 s Vette could do? What do you predict for average acceleration? What do you predict for average deceleration?
In-Class Practice Problem 3 How fast is 15 m/s in mph? A little over 30 mph Is this something a mid 80 s to early 90 s Vette could do? Yes. Maybe a bicycle too. What do you predict for average acceleration? What do you predict for average deceleration? Acceleration is slope of v-t. Straight line from origin to peak is about 15 [m/s] / 5 [sec] = 3 m/s2. Deceleration is 15 [m/s] / 10 [sec] = 1.5 m/s2