Bivariate Normal Data Analysis: LPGA 2008 Season Overview
Explore the analysis of bivariate normal data focusing on LPGA driving distance and fairway percent from the 2008 season. Learn how to compute confidence ellipses, estimated means, variance-covariance matrix, eigenvalues, eigenvectors, and plot insightful visualizations. Understand the method, set u
1 views • 8 slides

“Quantitative Data Analysis for Development - NEC Conference 2019 Overview”
Explore the key modules of the National Evaluation Capacities Conference 2019 focusing on quantitative data analysis for development. Covering topics such as basic concepts, summary statistics, bivariate analysis, hypothesis testing, data visualization, and the effective use of dummy tables in evalu
0 views • 25 slides

Statistical Application in FRSC Operations
In the study of central tendency and variability measures, bivariate data comes into play when relating pairs of measurements involving two variables. This lecture delves into the coefficient of correlation, which quantifies relationships between random variables. The aim is to familiarize participa
2 views • 14 slides
Landslide Susceptibility Using Frequency-Ratio Method
This informative content delves into the Frequency-Ratio Method for Landslide Susceptibility Index (LSI), supported by the National Science Foundation. It explains how Frequency-Ratio (FR) methods are used for analyzing landslide susceptibility, the mathematical calculations involved in determining
0 views • 15 slides

Different Types of Data in Statistics
Explore various types of data in statistics including discrete, categorical, bivariate, ordinal, and continuous data. Learn how to distinguish between these data types through examples and understand how they are used for data collection and analysis in different scenarios.
0 views • 8 slides
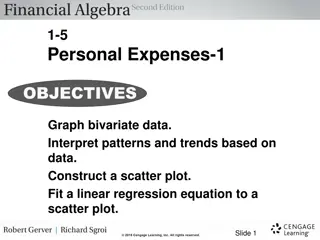
Bivariate Data Analysis: Trends and Predictions
Explore bivariate data analysis, scatter plots, linear regression, correlation coefficients, and trend predictions. Learn how to interpret patterns, fit regression equations, and make predictions based on data. Discover the relationship between variables in real-life scenarios through examples and k
0 views • 17 slides
Regression Analysis in Data Science
Explore the principles of regression analysis in data science, focusing on bivariate regression and linear models. Learn how to write the equation of a line to describe relationships between variables and assess the goodness of fit using scatterplots, correlation coefficients, determination coeffici
2 views • 29 slides
Graphical Methods for Data Distributions
In this chapter, Kathy Fritz presents graphical methods for describing data distributions. It covers variables, data types (univariate, bivariate, multivariate), categorical and numerical variables, and their characteristics. Understand the distinctions between different types of data and variables,
0 views • 70 slides
Describing Bivariate Data: Graphical Analysis and Interpretation
Bivariate data analysis involves exploring the relationship between two variables through graphical representations such as comparative bar charts, line charts, and scatterplots. These visualizations help in understanding patterns, strength of relationships, and identifying outliers or clusters in t
0 views • 26 slides

Auckland University Statistics Workshop for Teachers
In November 2019, Neil Marshall organized a Statistics Day Workshop at Auckland University to support teachers new to NCEA in making accurate judgements for statistics Achievement Standards. The workshop focused on Level 1 AS but was relevant for Levels 2 and 3 as well. Resources and guides for seco
0 views • 18 slides

Bivariate Genetic Analysis Practical
Genetic analysis, Twin covariances, Bivariate, Heritability, Variance decomposition
0 views • 15 slides

Drawing Line of Best Fit for Bivariate Data
A line of best fit can be drawn by eye for bivariate data to show correlation. Understanding the steps is essential; finding means, plotting the mean point on a scatter diagram, and drawing a line through the point that fits the trend. Interpolating between poles is generally reliable, but extrapola
0 views • 20 slides

Selecting Data Analysis Techniques: Bivariate Methods Explained
In this PowerPoint, the focus is on bivariate data analysis techniques, specifically linear regression. The presentation delves into the concept of linear models for two numerical variables and explores examples like predicting weights from heights and analyzing correlations between various factors.
0 views • 19 slides

Using Gapminder to explore Bivariate data
Dive into bivariate data analysis using Gapminder at De La Salle College with Ricky Pedersen. Explore relationships between two variables and gain insights into statistical trends and patterns. Understand how to interpret and visualize data effectively to draw meaningful conclusions. This hands-on a
0 views • 16 slides

The Influence of Third Variables in Hypothesis Testing
Delve into the significance of third variables and trivariate hypotheses in bivariate hypothesis testing through examples and theoretical concepts. Explore potential effects of third variables, including moderators, confounders, and intervening variables. Consider the impact of social class and meta
0 views • 16 slides
Understanding Statistical Relationship in Econometrics
Explore the concept of statistical relationship in econometrics, focusing on characterizing the relationship between variables of interest and related ones. Learn about bivariate distribution, conditional moments, sample data analysis, and the impact of conditioning on reducing variation in economet
1 views • 47 slides

Discrete Choice Modeling: Bivariate & Multivariate Probit Analysis
Explore the application of bivariate and multivariate probit models in discrete choice modeling, with a focus on analyzing health care usage data and understanding the relationship between binary variables through tetrachoric correlation. Learn about model specification, estimation, inference, and m
1 views • 43 slides

Interpreting Data with Two-Way Frequency Tables
Learn how to represent and interpret data using two-way frequency tables, joint frequency, marginal frequency, and conditional relative frequency. Discover the importance of capturing survey information in bivariate tables. Dive into examples and understand the significance of joint and marginal fre
0 views • 17 slides
Analyzing Bivariate Data in Excel for Correlation and Regression
Learn how to calculate correlation coefficients and perform simple linear regression in Excel using Example 4.1 data. Follow step-by-step instructions with screenshots to summarize bivariate data effectively.
0 views • 13 slides
Understanding Data Sampling and Surveys for Statistical Analysis
Learn about qualitative and quantitative data, univariate and bivariate datasets, types of sampling methods, and evaluating sample validity in statistical studies. Explore examples and methods for effective data collection and analysis in surveys.
0 views • 11 slides
Statistical Decision Making with Bivariate Data in Excel
Learn how to perform statistical decision making with bivariate data using Excel. This includes conducting contingency tests, hypothesis tests for regression model coefficients, and interpreting the results for informed decision-making. Follow step-by-step instructions and utilize tools like CHISQ.T
0 views • 13 slides
Understanding Bivariate Random Variables and Probabilities Analysis
Explore the concepts of bivariate random variables, joint probabilities, and independence in statistics and data analysis. Learn about inherited color blindness probabilities, independent random variables, and the definition of independence in statistical analysis.
0 views • 46 slides