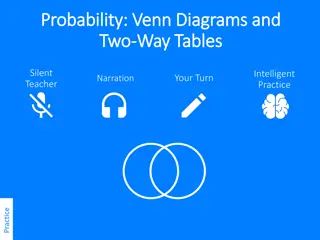
Understanding Two-Way Tables and Venn Diagrams in Probability

Exploring the concepts of two-way tables and Venn diagrams in probability, this lesson delves into finding probabilities using these tools. Whether dealing with mutually exclusive or non-mutually exclusive events, the addition rule is applied to calculate probabilities accurately. Illustrated with examples like the preference survey of high school students, the lesson emphasizes the practical applications of these statistical methods in real-world scenarios.

Download Presentation

Please find below an Image/Link to download the presentation.
The content on the website is provided AS IS for your information and personal use only. It may not be sold, licensed, or shared on other websites without obtaining consent from the author. Download presentation by click this link. If you encounter any issues during the download, it is possible that the publisher has removed the file from their server.
E N D
Presentation Transcript
Probability Lesson 4.3 Two-Way Tables and Venn Diagrams Statistics and Probability with Applications, 3rdEdition Starnes & Tabor Bedford Freeman Worth Publishers
Two-Way Tables and Venn Diagrams Learning Targets After this lesson, you should be able to: Use a two-way table to find probabilities. Calculate probabilities with the general addition rule. Use a Venn diagram to find probabilities. Statistics and Probability with Applications, 3rdEdition 2 2
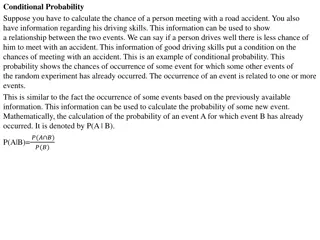
Two-Way Tables and Venn Diagrams Mutually exclusive events A and B cannot both happen at the same time. For such events, A or B means that only event A happens or only event B happens. You can find P(A or B) with the addition rule for mutually exclusive events: P(A or B) = P(A) + P(B) How can we find P(A or B) when the two events are not mutually exclusive? Now we have to deal with the fact that A or B means one or the other or both. When you re trying to find probabilities involving two events, like P(A or B), a two-way table can display the sample space in a way that makes probability calculations easier. Statistics and Probability with Applications, 3rdEdition 3 3
Happy, Healthy, Rich, or Famous? Happy, Healthy, Rich, or Famous? Two Two- -way tables and probability way tables and probability One question on the Census at School survey (http://www.amstat.org/censusatschool/index.cfm) asks students if they would prefer to be happy, healthy, rich or famous. Students may only choose one of these responses. The two-way table below summarizes the responses of 218 high school students from the United States by gender. GENDER Female 90 20 10 0 120 Male 46 13 31 8 98 Total 136 33 41 8 218 Happy Healthy Rich Famous Total STATUS Statistics and Probability with Applications, 3rdEdition 4 4
Happy, Healthy, Rich, or Famous? Happy, Healthy, Rich, or Famous? Two Two- -way tables and probability way tables and probability GENDER Female 90 20 10 0 120 Male 46 13 31 8 98 Total 136 33 41 8 218 Happy Healthy Rich Famous Total STATUS PROBLEM: Suppose we choose a student at random from these 218 students. Define event A as getting a female student and event B as getting a student who prefers to be happy. (a) Find P(B). Interpret this value in context. 136 218 ( ) ( ) = = 0.624. P B P happy There is about a 62% chance that a randomly selected student from these 218 students will prefer to be happy. Statistics and Probability with Applications, 3rdEdition 5 5
Happy, Healthy, Rich, or Famous? Happy, Healthy, Rich, or Famous? Two Two- -way tables and probability way tables and probability GENDER Female 90 20 10 0 120 Male 46 13 31 8 98 Total 136 33 41 8 218 Happy Healthy Rich Famous Total STATUS PROBLEM: Suppose we choose a student at random from these 218 students. Define event A as getting a female student and event B as getting a student who prefers to be happy. (b) Find P(female and happy). 90 218 0.413. P(female and happy) = Statistics and Probability with Applications, 3rdEdition 6 6
Happy, Healthy, Rich, or Famous? Happy, Healthy, Rich, or Famous? Two Two- -way tables and probability way tables and probability GENDER Female 90 20 10 0 120 Male 46 13 31 8 98 Total 136 33 41 8 218 Happy Healthy Rich Famous Total STATUS PROBLEM: Suppose we choose a student at random from these 218 students. Define event A as getting a female student and event B as getting a student who prefers to be happy. (c) Find P(A or B). + + + + 90 20 10 0 46 218 166 218 = P(A or B) = P(female or happy) = 0.303. Statistics and Probability with Applications, 3rdEdition 7 7
Two-Way Tables and Venn Diagrams When you re trying to find probabilities involving two events, like P(A or B), a two-way table can display the sample space in a way that makes probability calculations easier. Consider the example about pierced ears in males and females. Statistics and Probability with Applications, 3rdEdition 8 8
Two-Way Tables and Venn Diagrams We can t use the addition rule for mutually exclusive events unless events A and B have no outcomes in common. In the example, there are 19 outcomes that are shared by events A and B the students who are male and have a pierced ear. If we did add the probabilities of A and B, we d get 90/178 + 103/178 = 193/178. This is clearly wrong because the probability is bigger than 1! Statistics and Probability with Applications, 3rdEdition 9 9
Two-Way Tables and Venn Diagrams We can fix the double-counting problem illustrated in the two-way table by subtracting the probability P(male and pierced ear) from the sum. This result is known as the general addition rule. The General Addition Rule for Two Events If A and B are any two events resulting from some chance process, the general addition rule says that P(A or B) = P(A) + P(B) P(A and B) Statistics and Probability with Applications, 3rd Edition 10 10
Cell phone or landline? Cell phone or landline? General addition rule General addition rule PROBLEM: In one large city, 92% of all residents have a cell phone, 64% have a landline, and 59% have both. What s the probability that a randomly selected resident has a cell phone or a landline? Let C = has a cell phone and L = has a landline. P(C or L) = P(C) + P(L) P(C and L) = 0.92 + 0.64 0.59 = 0.97 Statistics and Probability with Applications, 3rd Edition 11 11
Two-Way Tables and Venn Diagrams Two-way tables can be used to illustrate the sample space of a chance process involving two events. So can Venn diagrams. Venn Diagram A Venn diagram consists of one or more circles surrounded by a rectangle. Each circle represents an event. The region inside the rectangle represents the sample space of the chance process. Statistics and Probability with Applications, 3rd Edition 12 12
Two-Way Tables and Venn Diagrams In the previous examples, our events of interest were A: is male and B: has a pierced ear. Here is the two-way table that summarizes the data. Statistics and Probability with Applications, 3rd Edition 13 13
Two-Way Tables and Venn Diagrams Some standard vocabulary and notation have been developed to make our work with Venn diagrams a bit easier. The complement AC contains the outcomes that are not in A. Statistics and Probability with Applications, 3rd Edition 14 14
Two-Way Tables and Venn Diagrams The event A and B is also called the intersection of A and B. The corresponding notation is A B. The event A or B is also known as the union of A and B. The corresponding notation is A B. Statistics and Probability with Applications, 3rd Edition 15 15
Two-Way Tables and Venn Diagrams Intersection, Union The event A and B is called the intersection of events A and B. It consists of all outcomes that are common to both events, and is denoted A B. The event A or B is called the union of events A and B. It consists of all outcomes that are in event A or event B, or both, and is denoted A B. With this new notation, we can rewrite the general addition rule in symbols as: P(A B) = P(A) + P(B) P(A B) Statistics and Probability with Applications, 3rd Edition 16 16
Who has pets? Who has pets? Venn diagrams and probability Venn diagrams and probability PROBLEM: In one large city, 40% of all households own a dog, 32% own a cat, and 18% own both. Suppose we randomly select a household and record which type of pet is owned by that household. (a) Make a Venn diagram to display the sample space of this chance process using the events D: owns a dog and C: owns a cat. Statistics and Probability with Applications, 3rd Edition 17 17
Who has pets? Who has pets? Venn diagrams and probability Venn diagrams and probability PROBLEM: In one large city, 40% of all households own a dog, 32% own a cat, and 18% own both. Suppose we randomly select a household and record which type of pet is owned by that household. (b) Find the probability that the resident owns a dog and not a cat. P(owns only a dog) = P(owns a dog) P(owns both) = 0.40 0.18 = 0.22 Statistics and Probability with Applications, 3rd Edition 18 18
LESSON APP 4.3 Who owns a home? What is the relationship between educational achievement and home ownership? A random sample of 500 U.S. adults was selected. Each member of the sample was identified as a high school graduate (or not) and as a homeowner (or not). The two-way table displays the data. Suppose we choose a member of the sample at random. Define events G: is a high school graduate and H: is a homeowner. 1. 2. Explain why P(G or H) P(G) + P(H). Then find P(G or H). Make a Venn diagram to display the sample space of this chance process. Write the event is not a high school graduate but is a homeowner in symbolic form. 3. Statistics and Probability with Applications, 3rd Edition 19 19
LESSON APP 4.3 Who owns a home? 1. Explain why P(G or H) P(G) + P(H). Then find P(G or H). 2. Make a Venn diagram to display the sample space of this chance process. 3. Write the event is not a high school graduate but is a homeowner in symbolic form. Statistics and Probability with Applications, 3rd Edition 20 20
Two-Way Tables and Venn Diagrams Learning Targets After this lesson, you should be able to: Use a two-way table to find probabilities. Calculate probabilities with the general addition rule. Use a Venn diagram to find probabilities. Statistics and Probability with Applications, 3rd Edition 21 21