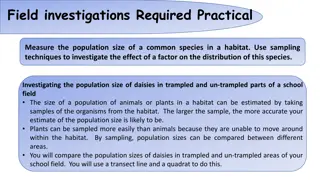
Quantitative Study of Plants and Animals Ecosystem Using Quadrats
Conduct a quantitative study of plants and animals in a selected sample area using quadrats. Utilize frame and point quadrats to measure frequency and percentage cover of organisms. Randomly place quadrats, record data, and calculate average percentage cover. Create frequency tables and graphs to visualize the data obtained from the study.

Download Presentation

Please find below an Image/Link to download the presentation.
The content on the website is provided AS IS for your information and personal use only. It may not be sold, licensed, or shared on other websites without obtaining consent from the author. Download presentation by click this link. If you encounter any issues during the download, it is possible that the publisher has removed the file from their server.
E N D
Presentation Transcript
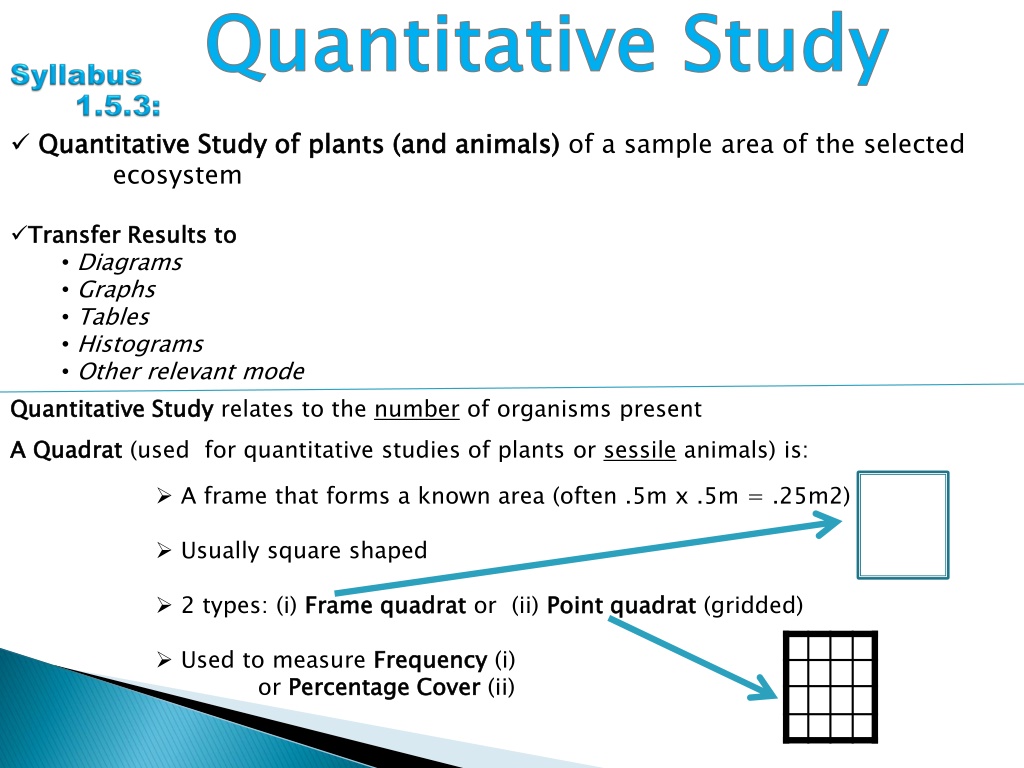
Quantitative Study Quantitative Study Quantitative Study of plants (and animals) ecosystem Quantitative Study of plants (and animals) of a sample area of the selected Transfer Results to Diagrams Graphs Tables Histograms Other relevant mode Quantitative Study A Quadrat A frame that forms a known area (often .5m x .5m = .25m2) Transfer Results to Quantitative Study relates to the number of organisms present A Quadrat (used for quantitative studies of plants or sessile animals) is: Usually square shaped 2 types: (i) Frame quadrat Frame quadrat or (ii) Point Point quadrat quadrat (gridded) Used to measure Frequency Frequency (i) or Percentage Cover Percentage Cover (ii)
Using a FRAME FRAME quadrat Using a POINT POINT quadrat Percentage Cover ground occupied by aerial parts of a named plant within the sample area (expressed as a percentage of the total area) used for cover plants e.g. grass Percentage Cover = the area of Frequency named organism within the sample area Frequency = The chance of finding a 1. Throw the frame quadrat (size must match survey area for accuracy) randomly in the 1. Throw the point quadrat (size must match survey area sample area (safely? how? ) for accuracy) randomly in the sample area (safely? how?) 2. Record the presence or absence of the 2. Lower the needle at each of the 25 sampling point s - i.e. where wires cross named organism within each quadrat 3. Repeat for a number of throws (more 3. Record the number of hits at the sampling points i.e. if plant touches the needle at one of the 25 cross points that represents 4% cover (so multiply hits by 4) throws, more accuracy) 4. Tabulate results 5. Calculate using formula below: (can be converted to a percentage by multiplying 4. Repeat for a number of throws (more throws, more by 100) accuracy) to get the average . . No of quadrats . with org present = Frequency 5. Tabulate results No of quadrats thrown 6. Calculate average percentage cover
Frequency table Frequency table Quadrat throw Organism 1 2 3 4 5 6 7 8 9 10 Total Frequency % Frequency . No of quadrats . containing organism = Frequency No of quadrats thrown If percentage is required multiply frequency by 100
Chart/Graph of Frequency % Frequency 60% 50% 40% % Frequency 30% % Frequency 20% 10% 0% Buttercup Daisy Dandelion Grass Plant name
Quadrat throw Total no. of Hits Plant Name Grass 1 2 3 4 5 6 7 8 9 10 Total Points % Cover 250 250 No . of hits = % Cover 100 otal no . of po int s
Pie Chart of Percentage Cover Percentage (ground) Cover Percentage (ground) Cover Creeping buttercup 10% others 5% Grass 85%