Analysis of Mosquito Collection Data: Net Weight, Water Coating, and Model Fitting
This analysis includes tables detailing the weight of batch 13 nets, mean water and insecticide for coating the net, model fitting of Poisson models for mosquito count dataset, and modeling fitting of ZIP and ZINB models for trap collection data. The tables provide valuable insights into net properties and statistical modeling related to mosquito trapping and data analysis.
Download Presentation

Please find below an Image/Link to download the presentation.
The content on the website is provided AS IS for your information and personal use only. It may not be sold, licensed, or shared on other websites without obtaining consent from the author. Download presentation by click this link. If you encounter any issues during the download, it is possible that the publisher has removed the file from their server.
E N D
Presentation Transcript
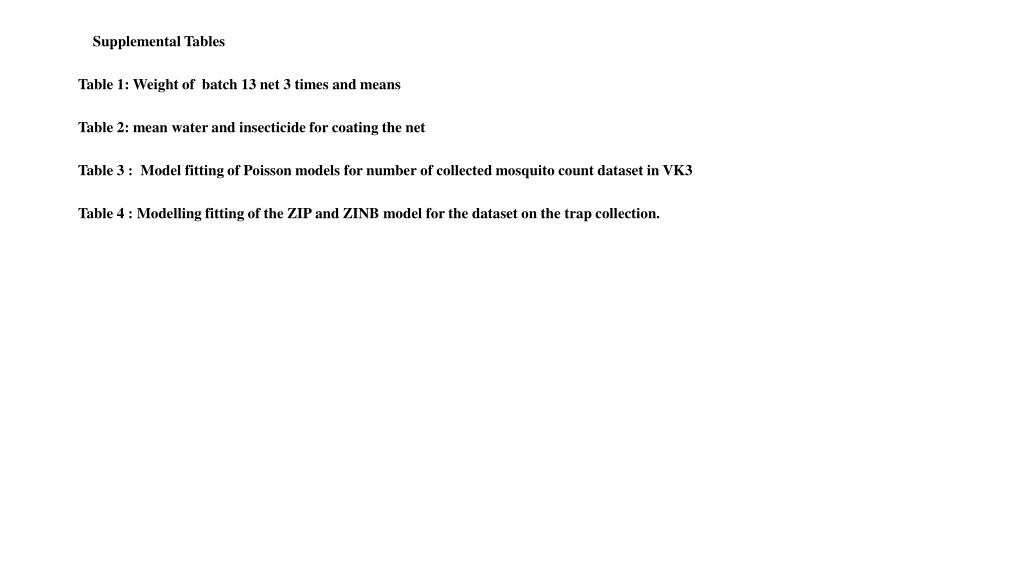
Supplemental Tables Table 1: Weight of batch 13 net 3 times and means Table 2: mean water and insecticide for coating the net Table 3 : Model fitting of Poisson models for number of collected mosquito count dataset in VK3 Table 4 : Modelling fitting of the ZIP and ZINB model for the dataset on the trap collection.
Table 1: Weight of batch 13 net 3 times and means Net weighing Order Identity batch 13 1x 2x 3x Mean 12 m (6*2) 1 292.45 291.75 291.8 292 2 12 m (7,5*2) 309.35 308.95 308.9 309.066667 3 12 m (6*2) 293.8 293.15 293 293.316667 4 12 m (6*2) 288.8 288.7 288.55 288.683333 5 9,576m 271.75 271.45 271.45 271.55 6 12 m sewed 205.9 205.75 205.8 205.816667 7 12 m sewed 204.25 204.15 204.15 204.183333
Table 2: mean water and insecticide for coating the net weighted on 03JUNE 2015 Batch 13 Weigh 12 m (6*2) 9,576m 12 m sewed Batch 4 batch 5 batch 8 batch 10 batch 12 batch 14 batch 18 batch 22 w1 292.45 271.75 205.9 127.65 137.65 153.3 199.95 154.2 161.5 193.75 217.7 w2 291.75 271.45 205.75 127.6 137.6 153.3 198.8 154.2 161.45 193.7 217.45 w3 291.8 271.45 205.8 127.6 137.7 153.4 198.9 154.35 161.35 194.05 217.45 w4 293.8 - 204.25 147.45 140.65 148.45 173.25 157.25 187.75 190.9 213.85 w5 293.15 - 204.15 147.5 140.65 148.45 173.25 157.25 187.6 190.9 214 w6 293 - 204.15 147.2 140.65 148.7 173.45 157.25 187.95 190.85 213.95 w7 288.8 - - - - - - - - - - w8 288.7 - - - - - - - - - - w9 288.55 - - - - - - - - - - mean 291.3333333 271.55 205 137.5 139.15 150.933333 186.266667 155.75 174.6 192.358333 215.733333 sdev 2.088659857 0.17320508 0.89666047 10.8271418 1.64347193 2.63090605 14.1919226 1.64408029 14.4238691 1.62031376 1.97450416 rac 3 1.73205081 2.44948974 2.44948974 2.44948974 2.44948974 2.44948974 2.44948974 2.44948974 2.44948974 2.44948974 se 0.696219952 0.1 0.3660601 4.42016214 0.67094461 1.0740629 5.79382813 0.67119297 5.8885199 0.66149032 0.80608795
Table 3 : Model fitting of Poisson models for number of collected mosquito count dataset in VK3 Zero inflated Poisson mixed model with Zero inflated Poisson mixed model with fixed covariates, fixed covariates, random intercept (month, village) and inflation term trapping method random intercept (month, village) and inflation term constant Fixed covariate (Intercept) Trap_trap Status_dead rainfall humidity gono_status 3.8532* 1.5545* (-0.7987) * -0.0015 (-0.0110) * (-0.4299) * (Intercept) traptrap statusdead rainfall humidity gono_status bloodfed 3.8423* 1.5536* (-0.8175) * (-0.0022) * (-0.0108) * (-0.4426) * bloodfed gono_status_ (-1.7745) * gono_status_gravid (-1.7828) * gravid variance variance rand/residual var Random effects rand/residual var 0.0077/0.0882 0.0236/0.1536 month village ~1 month village ~trap 0.0108/0.1043 0.0116/0.1075 Inflation term Intercept (-0.1676) * Intercept trap 0.1923* (-1.4153) * Metrics AIC BIC 51279 51338 AIC BIC 50576 50641
Table 4 : Modelling fitting of the ZIP and ZINB model for the dataset on the trap collection. Basic Count Model Zero-altered (alias hurdle Zero-inflated models) Poisson Quasi- Negative Poisson Negative Poisson Negative Variable poisson Binomial Binomial Binomial 2.459* 2.459* 2.502* 2.983* 2.627* 2.983* 2.723* Intercept -0.847* -0.847* -0.558* -0.722* -0.614* -0.719* -0.666* village(VK3) 2.189* 2.189* 2.756* 1.524* 1.467* 1.521* 1.611* Trapping method (trap) -1.146* -1.146* -2.609* -0.781* -0.979* -0.782* -0.988* Status (dead) 0.443* 0.443* 0.480* 0.355* 0.395* 0.355* 0.387* Month (august) 0.603* 0.603* 0.546* 0.516* 0.558* 0.516* 0.563* Month (september) 0.603* 0.603* 0.564* 0.659* 0.555* 0.659* 0.571* Month (october) -0.570* -0.570* -0.624* -0.429* -0.430* -0.429* -0.334* gono_status (bloodfed) -2.234* -2.234* -2.322* -1.747* -2.006* -1.743* -1.837* gono_status (gravid) 33.47 33.47 43.52 33.19 33.13 33.17 33.05 RMSE 13.65 13.65 17.97 13.46 13.38 13.46 13.32 MAE * Significant at = 0.05
