
Data Requirements and Inflow Calculations for Reservoir Storage-Yield Analyses
Explore the detailed data requirements essential for conducting storage-yield analyses with examples of data sources, emphasizing the significance of longer inflow records. Delve into the calculation methods for inflows using mass balance equations and learn about estimating inflows from nearby stre
0 views • 33 slides

Reservoir Storage-Yield Analyses Using HEC-ResSim Lecture #2
This lecture covers the theory of storage-yield analyses, focusing on understanding yield, types of yield like firm yield, methods to calculate yield, and the importance of storing water for re-distribution. It delves into within-year and over-year reservoir storage concepts, illustrating the minimu
9 views • 47 slides

Overview of Physical Hydrology and Hydroclimatology
Physical Hydrology and Hydroclimatology, a science focusing on water properties, distribution, and circulation, covers topics such as mass balance, watershed transfer functions, reservoir sizing, storage-yield analysis, and optimal yield calculations. The concept of optimal yield highlights the impo
4 views • 10 slides
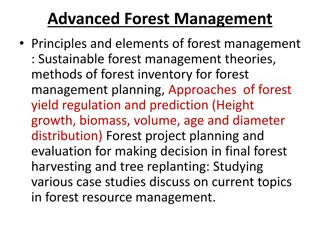
Principles of Advanced Forest Management
Explore sustainable forest management theories, inventory methods, yield regulation approaches, and project planning for effective decision-making in forest resource management. Delve into the principles of forest management, land classification, growth projection, yield prediction, and sustainable
0 views • 26 slides

Maximum Price Calculation for Callable Bond with Annual Yield Requirement
A 20-year callable bond example is provided with a $1000 face value and 3% annual coupons, callable at different redemption values over specific years. The task is to determine the maximum price a buyer should pay to achieve a minimum annual yield of 5%. The calculation involves identifying the time
3 views • 33 slides

Callable Bonds in Bond Investments
Callable bonds are a type of bond where the issuer reserves the right to redeem the bond at different times, potentially at different values. Investors face uncertainty about when the bond will be redeemed, but it can only be called at predetermined times. Common questions revolve around determining
1 views • 13 slides
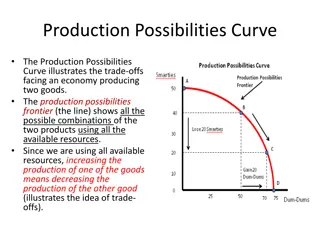
Production Possibilities Curve and Economic Growth
The Production Possibilities Curve illustrates trade-offs in an economy producing two goods, showing possible combinations using available resources. Efficiency on the curve means no way to make some better off without others worse off. Opportunity cost is the given-up production when increasing one
0 views • 5 slides

Monetary Policy Effectiveness in the IS-LM Framework
The relative effectiveness of monetary policy in influencing investment, employment, output, and income depends on the shape of the LM curve and the IS curve. A steeper LM curve signifies higher effectiveness as it indicates less interest elastic demand for money, resulting in significant changes in
1 views • 24 slides

Effects of Micronutrients on Maize Grain Yield and Macronutrients Uptake
Micronutrients play a vital role in promoting strong and steady growth in crops like maize, leading to higher yields and improved harvest quality. This study aims to assess the impact of micronutrient supplementation, specifically Cu, Fe, and Zn, on maize grain yield and the uptake of macronutrients
0 views • 15 slides

The Normal Probability Curve
The Normal Probability Curve, also known as the normal distribution, is a fundamental concept in statistics. It is symmetric around the mean, with key characteristics such as equal numbers of cases above and below the mean, and the mean, median, and mode coinciding. The curve's height decreases grad
1 views • 10 slides

Strength-Duration Curve in Neuromuscular Stimulation
The strength-duration curve depicts the relationship between electrical stimulus intensity and time required for minimal muscle contraction. It helps assess nerve damage in lower motor neuron lesions. Various types of curves exist based on innervation status, such as normal innervation, complete den
1 views • 15 slides
Simplified Linear Transformation for N Application Rates in Corn and Wheat
Dr. Brenda Ortiz and Dr. Bill Raun led an investigation on predicting grain yield using optical sensors in corn and wheat. The challenges with the symmetric sigmoid model for yield prediction led to the development of a simplified linear transformation approach. Assumptions were made to create a mod
1 views • 28 slides
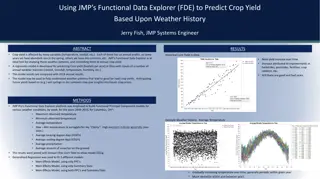
Predicting Crop Yield Using JMP's Functional Data Explorer
Crop yield prediction based on historical weather data in Ohio using JMP's Functional Data Explorer. A regression model is developed to forecast corn yield, correlating weather variables like temperature, rainfall, humidity, etc. Results show insights into weather patterns affecting crop yields, pot
0 views • 5 slides

Advancements in Potato Leafhopper-Resistant Alfalfa Cultivars
Potato leafhopper-resistant alfalfa cultivars have shown significant improvement in resistance levels, reducing the need for insecticides and enhancing agronomic performance. Introduced in 1997, these cultivars, such as PIONEER 5454, DK 131 HG, and EVERGREEN, have demonstrated enhanced yield and res
1 views • 14 slides
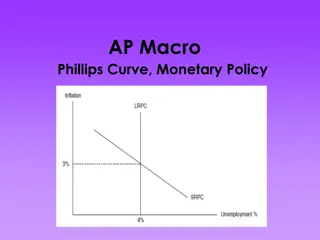
The Phillips Curve and Its Implications
The Phillips Curve, introduced by economist A.W. Phillips in 1958, initially showed an inverse relationship between unemployment rate (u%) and inflation rate (tt%). This led policymakers to consider a trade-off between reducing unemployment and increasing inflation. However, the concept faced challe
1 views • 22 slides

Nonlinear Curve Fitting Techniques in Engineering
Utilizing nonlinear curve fitting techniques is crucial in engineering to analyze data relationships that are not linear. This involves transforming nonlinear equations into linear form for regression analysis, as demonstrated in examples and methods such as polynomial interpolation and exponential
0 views • 18 slides

National Corn Yield Contest Supervisor Guide
The National Corn Yield Contest (NCYC) Supervisor Guide emphasizes the importance of supervisor roles in verifying yield accuracy for the competition's success. It covers supervisor qualifications, field requirements, pre-harvest inspections, measurement methods, and the supervisor's presence during
0 views • 15 slides

Chemistry Exam Review: Topics in Scientific Notation, Molecular Weight, Stoichiometry, and Limiting Yield
Explore key concepts in chemistry, including scientific notation, molecular weight calculations, reaction balancing, stoichiometry, and limiting yield problems. Prepare for an upcoming exam by practicing various problems and conversions related to these topics, such as expressing numbers in scientif
1 views • 4 slides

Precision Agriculture Techniques for Variable Rate Seeding
Precision agriculture practices, led by experts like Chad Godsey, focus on tailored approaches for variable rate seeding. The philosophy emphasizes individualized planning and continuous dialogue with producers. Utilizing yield data and prescriptions, decision-making is based on various factors like
1 views • 17 slides

Bond Valuation Models and Yield Relationship
Explore the fundamentals of bond valuation, including the present value model and the yield model, to understand how bond prices are determined based on factors like market price, coupon payments, and yield to maturity. Learn about the price-yield curve, convexity, and how to calculate expected yiel
1 views • 25 slides

Enhancing Crop Yield Mapping Through Novel Sensing Approach
Case IH, a leader in farm equipment, aims to boost the resolution of yield maps generated during harvest. Current methods provide only average yield data, missing crucial details. By introducing a novel sensing approach utilizing crop height detection technology, a more precise and detailed resoluti
1 views • 11 slides

Practical Guide to Drawing Long-Term Yield Curve at Krugersdrift Dam
Learn how to draw a long-term yield curve at Krugersdrift Dam step-by-step, including setting up the study, browsing for data, importing hydrology files, manipulating the curve for accuracy, and achieving the final result.
0 views • 7 slides

Plastic Anisotropy and Yield Surfaces in Material Mechanics
This lecture introduces the concept of yield surfaces in material mechanics, focusing on both single crystal and polycrystal levels. It covers topics such as defining yield surfaces, common yield functions like Tresca and von Mises, construction methods for single slip systems, and the influence of
0 views • 53 slides
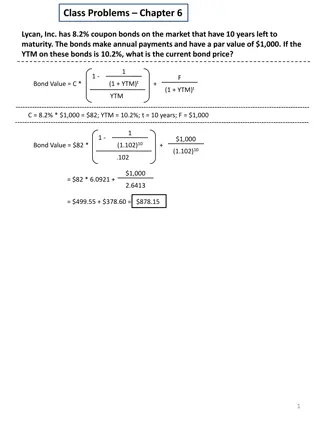
Bond Pricing and Yield Calculation Examples
The provided content illustrates calculations for bond pricing and yield in various scenarios. It covers topics such as determining current bond prices based on coupon rates, yield to maturity, and time to maturity. Additionally, it explores scenarios with different bond characteristics like annual
1 views • 5 slides

Humistart Trial 2017-2018: Improving Hay Yield and Quality
Conducted in Westmoreland County, Virginia, the Humistart trial aimed to observe yield response, soil changes, forage quality, and return on investment. Results indicated an increase in hay yield and quality, with notable improvements in crude protein and calcium content. Despite no significant pH c
1 views • 9 slides
Influence of Late Nitrogen Applications on Corn Yield on Mississippi River Alluvial Soils - 2017 NUE Conference
Excessive rainfall in the lower Mississippi Delta can lead to late-season nitrogen deficiency in corn crops. Research conducted at the LSU AgCenter focused on evaluating the efficacy of supplemental nitrogen at late growth stages on Mississippi River alluvial soils. Field experiments from 2006 to 20
0 views • 19 slides

Regional Agronomic Diagnosis for Greenhouse Tomato in South Uruguay
The sustainability of vegetable farms in South Uruguay is at risk due to low crop yields, which are significantly lower than attainable yields in the region. A study was conducted to identify strategies to reduce yield gaps for greenhouse tomato crops. By analyzing yield variability and gaps among f
0 views • 21 slides

Production Possibilities Curve and Economic Growth
Explore the concept of the production possibilities curve, including its assumptions, implications of being under or beyond the curve, types of opportunity costs, shifts in the curve, and the impact of economic growth on a nation's productivity and output capacity.
0 views • 18 slides

Linear Programming
Water resources planning and management involve utilizing linear programming models to optimize decision-making for water allocation, storage, and yield. This involves constraints such as maximizing or minimizing objectives subject to linear equations. Firm yield and storage capacity play critical r
0 views • 36 slides

Parametric Sensitivity Analysis
In a Silicon-Fab environment, the Parametric Sensitivity Analysis (PSA) algorithm is utilized to determine key performance indicators affecting wafer yield. This method helps identify important predictors amidst noise and outliers in the data, providing a ranked list based on R2 values and P-values.
0 views • 5 slides

Introduction to Airline Yield Management Understanding the Fundamentals and Importance in the Aviation Industry
In the highly competitive aviation industry, airlines continuously seek ways to maximize revenue while optimizing seat availability. This is where airline yield management comes into play. Yield management, also known as revenue management, is a stra
1 views • 6 slides

Yield in Property Investment
Yield calculation in property investment involves determining the returns investors seek on their money. For residential development, it encompasses sales of units and income from rentals. Commercial properties value is determined by income multiplied by yield, reflecting investor risk appetite.
0 views • 4 slides

Understanding USDA Yield Grades in Beef
Yield grades in beef categorize the amount of edible meat a carcass will produce based on factors like fat thickness and muscle area. Learn how to calculate yield grade and interpret grades to determine meat quality.
3 views • 8 slides

Yield Modeling for Exoplanet Observation Missions
Yield modeling in space missions is crucial to determine the scientific output and optimize operations. Topics covered include computing completeness and yield, the impact of astrophysical assumptions, integration times, and mission constraints. Engage in group projects to plan and optimize exoplane
0 views • 7 slides

Enhancing Biogas Yield Through Post-Treatment of Residual Sludge
This report discusses the feasibility and benefits of increasing biogas yield through post-treatment of residual sludge. The study includes a detailed analysis of the process, findings from digestion tests, and conclusions drawn indicating a significant boost in biogas production. The post-treatment
0 views • 7 slides

Fission Yield Studies in (n,f) Reactions at CNRS/LPSC Institute
Fission yield studies in (n,f) reactions are conducted at the CNRS/LPSC Institute to evaluate and test assumptions in fission yield models. The program focuses on isomeric ratios, isotopic distributions, and measuring kinetic energies using spectrometry techniques with the LOHENGRIN spectrometer.
0 views • 13 slides

Photon Yield and Coefficient Analysis in Gluon Fusion
Dive into the world of prompt photon yield and coefficient analysis from gluon fusion induced by magnetic fields. Explore the significance of magnetic fields in heavy-ion collisions and their role in photon production. Discover the insights provided by calculations on the yield and elliptic flow, sh
1 views • 10 slides

The Evolution of Airline Yield Management
Yield management has been a game-changer in the airline industry, revolutionizing how airlines optimize revenue. Over the years, advancements in technology, data analytics, and consumer behavior analysis have shaped modern airline yield management st
1 views • 4 slides

Forage Options and Yield Estimation for Drought-Stressed Corn
Explore forage options like silage and grazing for drought-stressed corn, along with methods to estimate yield based on grain yield, plant height, and actual measurements. Learn about nutrient content, conversion of silage to hay yield, and the value of normal corn silage in different scenarios.
0 views • 22 slides

Calculate Percent Yield in Chemistry Experiments
Learn how to calculate percent yield in chemistry experiments by understanding theoretical yield, actual yield, and efficiency. Practice problems provided for better understanding.
0 views • 5 slides