Regional Agronomic Diagnosis for Greenhouse Tomato in South Uruguay
The sustainability of vegetable farms in South Uruguay is at risk due to low crop yields, which are significantly lower than attainable yields in the region. A study was conducted to identify strategies to reduce yield gaps for greenhouse tomato crops. By analyzing yield variability and gaps among farmers, the main causes were determined, aiming to bridge the performance gap between under-performing and best-yielding crops. Assessment of cropping systems and environmental factors, along with data collection and analysis, provided insights into reducing yield variability and improving crop yields in the region.
Download Presentation

Please find below an Image/Link to download the presentation.
The content on the website is provided AS IS for your information and personal use only. It may not be sold, licensed, or shared on other websites without obtaining consent from the author.If you encounter any issues during the download, it is possible that the publisher has removed the file from their server.
You are allowed to download the files provided on this website for personal or commercial use, subject to the condition that they are used lawfully. All files are the property of their respective owners.
The content on the website is provided AS IS for your information and personal use only. It may not be sold, licensed, or shared on other websites without obtaining consent from the author.
E N D
Presentation Transcript
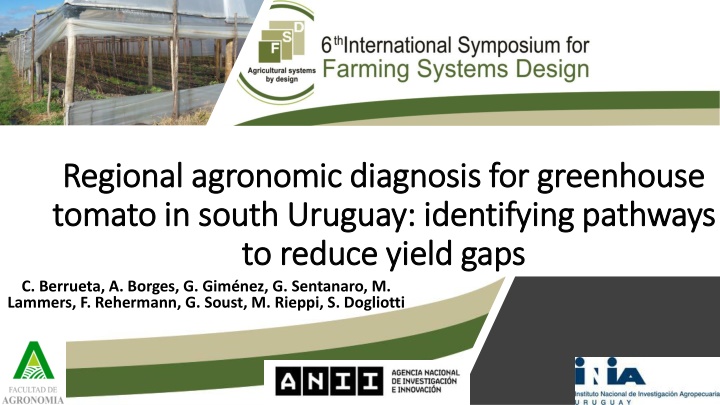
Regional agronomic diagnosis for greenhouse Regional agronomic diagnosis for greenhouse tomato in south Uruguay: identifying pathways tomato in south Uruguay: identifying pathways to reduce yield gaps to reduce yield gaps C. Berrueta, A. Borges, G. Gim nez, G. Sentanaro, M. Lammers, F. Rehermann, G. Soust, M. Rieppi, S. Dogliotti
Problem description Sustainability of most vegetable farms in Uruguay is threatened by: Low family income, driven by low crop yields which are on average 50% or less of the attainable yields in the region, with similar production resources and proper management (Dogliotti et al., 2014). There is a huge variability between farmers in crop yields, product quality and economic results. 30 Tomato yield (kg m-2) Greenhouse tomato case - season 2013 20 10 0 0 5000 10000 15000 20000 Greenhouse tomato area per farm (m2)
Yield variability and gaps Understanding and ranking the main causes of yield gaps and yield variability among farmers, according to agro-ecological conditions is needed to: Define on what practices should research and extension efforts focus on. Feedback to farmers and extension agents. Design strategies to reduce yield variability jointly with farmers, farmers organizations, technical advisors and extension services.
Objective Identify strategies to reduce the distance between under-performing and best- yielding greenhouse tomato crops in the south region of Uruguay. For this purpose: Gap to attainable yield was described and the main causes of yield variability were explored by combining regional agronomic diagnosis and yield gap analysis. (Dor et al., 2008 ; Lobell et al., 2009; Van Ittersum et al., 2013; FAO-DWFI, 2015).
Materials and methods Assessment of cropping systems and environmental variability in the region: defining criteria for sample selection. 110 tomato greenhouse crops within 23 farms during 2014/15 and 2015/16 were assessed, 10% of region s tomato producers. 1 On-farm data collection: assessment of cropping systems characteristics, environment and yield in sampled farmers fields (growth-defining, growth-limiting, and growth-reducing factors, and response variables: yield and yield components). 2 Identification and ranking of yield components and growth-defining factors responsible for variations in attainable yield. Tools: Path analysis, Spearman correlation and fitting boundary line models. 3 Estimation of relative yield gap attainable yield - actual yield / attainable yield. Attainable yield defined as the boundary line yield estimation, as a function of cumulated PAR intercepted. 4 Identification and ranking of growth-limiting and growth-reducing factors explaining yield gap through Classification and Regression trees. 5 Based on Scarlato et al. (2017)
Three production levels Radiation, temperature, RH. Greenhouse transmissivity. Fraction PAR intercepted. Transplanting date, cycle length. Plant density, pruning and lowering. Variety and seedling quality. Growth defining Potential Soil properties: physical and chemical. Irrigation and water balance. Fertilization, manures, fertigation. Attainable Growth limiting Pest and diseases: insects, nematodes, fungus and bacterial diseases. Weeds infestation and mulching. Growth reducing Actual Yield kg m-2 Van Ittersum and Rabbinge (1997)
Radiacin, temperatura, humedad. Transmisividad del invernadero. Luz interceptada por el cultivo. Fecha de transplante, largo de ciclo. Densidad de plantas, desbrotes, deshojes y bajadas de planta. Variedad y calidad de plant n. Potencial Factores determinantes Propiedades de suelo: f sicas y qu micas. Riego (vol men y distribuci n) y balance h drico. Fertilizaci n, enmiendas org nicas, fertirriego. Alcanzable Factores limitantes Presencia de principales enfermedades y plagas y su control. Control de malezas y mulch. Obtenido Factores reductores Rendimiento kg m-2 Variables de respuesta: Rendimiento, n mero de hojas, racimos, flores, frutos por planta y calibre de frutos.
Materials and methods Assessment of cropping systems and environmental variability in the region: defining criteria for selection of a representative sample of farms. 110 tomato greenhouse crops within 23 farms during 2014/15 and 2015/16 were assessed, 10% of region s tomato producers. 1 On-farm data collection: assessment of cropping systems characteristics, environment and yield in sampled farmers fields (growth-defining, growth-limiting, and growth-reducing factors, and response variables: yield and yield components). 2 Identification and ranking of yield components and growth-defining factors responsible for variations in yield. Tools: Path analysis, Spearman correlation and fitting boundary line models. 3 Estimation of relative yield gap attainable yield - actual yield / attainable yield. Attainable yield defined as the boundary line yield estimation, as a function of cumulated PAR intercepted. 4 Identification and ranking of growth-limiting and growth-reducing factors explaining yield gap through Classification and Regression trees. 5 Based on Scarlato et al. (2017)
Results and Discussion We observed high yield variability among crops ranged from 0.9 to 24.3 kg m-2with an average of 10.9 kg m-2. 15 Number of crops 10 5 0 < 5 5 - 7,9 8 - 10,9 11 - 13,9 14 - 16,9 17 - 19,9 Yield (kg m-2) > 20 2014-2015 ( ) and 2015-2016 ( )
Yield components and growth defining factors Crop yield (kg m-2) Yield component or environmental conditions Spearman Coefficient p-value Number of fruits per plant 0.74 <0.0001 Number of flowersper plant 0.69 <0.0001 Number of trusses per plant 0.72 <0.0001 Fruit diameter (mm) 0.20 0.0344 Growthperiod length (days) 0.61 <0.0001 Daily PAR Greenhouse transmissivity Fraction PAR intercepted (LAI) Cycle length Daily PAR intercepted1(MJ m-2d-1) 0.43 <0.0001 Cumulated PAR intercepted (MJ m-2) 0.80 <0.0001 Fraction PAR intercepted1(%) 0.38 0.0001 Stem density at transplantingdateper m2 0.01 0.9377 Wilted plants at harvest end (%) -0.02 0.8078 Average mean temperature( C) 0.31 0.0008 Average relative humidity (%) -0.25 0.01
Relative yield gap yi= 26.16 / (1 + 7.81 e-0.0036 xi) R2adj: 0.95 30 Yield (kg m-2) 20 10 Actual yield ( ) Boundary points ( ) 0 0 200 400 600 800 1000 1200 1400 1600 1800 Cumulated PAR intercepted by crops (MJ m-2) Average gap: 5.4 kg m-2, 34% of attainable yield Relative yield gap: (Attainable yield Actual yield) Attainable yield 33% in 2014/15 and 36% in 2015/16
Two complementary ways of increasing yield Increase cumulated PAR intercepted by crops by modifying growth-defining factors 30 23.1 Reduce attainable yield for each level of cumulated PAR intercepted by modifying growth-limiting reducing factors the gap to 20 Yield (kg m-2) 10 and 6.2 0 0 500 1000 1500 2000 Cumulated PAR intercepted by crops (MJ m-2)
Modifying growth-defining factors to increase cumulated PAR intercepted by crops Transplanting date Daily global radiation outside the greenhouses 2015/2016 (MJ m-2) Cycle type Spring/summer 21 Growing cycle lenght Autumn 11 Greenhouse transmissivity Average: 62% (minimum: 42%; maximum: 83%) Fraction PAR intercepted (plant density and leaf pruning intensity)
Fraction PAR intercepted Fraction PAR intercepted 0.56 Fraction PAR intercepted 0.85 Same phenological stage Wide differences in pruning intensity 30 Yield (kg m-2) yi= 19.90 / (1 + 4372715488.54 e-0.31 xi) + 4.35 20 10 Actual yield ( ) Boundary points ( ) 0 0.4 0.6 0.8 1 Fraction PAR intercepted
Two complementary ways of increasing yield Increase cumulated PAR intercepted by crops by modifying growth-defining factors 30 Reduce attainable yield for each level of cumulated PAR intercepted by modifying growth-limiting reducing factors the gap to 20 Yield (kg m-2) 10 and 0 0 500 1000 1500 2000 Cumulated PAR intercepted by crops (MJ m-2)
Modifying growth-limiting and reducing factors responsible for the gap to attainable yield at a given level of cumulated PAR intercepted Three groups according to cumulated PAR intercepted L M H 30 Yield (kg m-2) 20 10 Low PAR intercepted Medium PAR intercepted High PAR intercepted 0 0 500 1000 1500 2000 Cumulated PAR intercepted K fertigation Total K applied K in tissue analysis at harvest beginning Mg excess Hydric welfare index (ETr/ETc) White fly index during harvest Hydric welfare index (ETr/ETc) CART analysis Seedling height Soil organic carbon N fertigation White fly index during harvest Na exchangeable in soil
Modifying growth-limiting and reducing factors responsible for the gap to attainable yield at a given level of cumulated PAR intercepted L M H 30 Yield (kg m-2) Radiaci n interceptada acumulada 20 10 Baja Media Alta 0 0 500 1000 1500 2000 Potasio aplicado por fertirriego Potasio total aplicado Cumulated PAR intercepted Potasio en hoja a inicio de cosecha Exceso de magnesio Bienestar h drico (ETr/ETc) Indice de mosca blanca durante cosecha Bienestar h drico (ETr/ETc) CART analysis Altura del plant n al transplante Materia org nica del suelo Nitr geno aplicado por fertirriego Sodio intercambiable en el suelo Indice de mosca blanca durante cosecha
Pathways to yield increase Management practices Earlier planting dates (autumn crops). Plastic renewal improve greenhouse transmissivity. Reducing pruning increasing plant density (soil-borne diseases control) to increase LAI. Cumulated PAR increase and cleaning to 30 Tomato yield (kg m-2) intensity and 20 Enhance crop management for each PAR level 10 0 Adjustment of K and N nutrition. Irrigation improvement. Taller seedling. Whitefly control. Increase soil organic carbon and reduce sodium. 400 1000 1600 Cumulated PAR intercepted (MJ m-2)
Caminos para incrementar el rendimiento Pr cticas de manejo Transplantes m s tempranos (cultivos de oto o). Renovaci n de cubiertas pl sticas o limpieza para transmisividad del invern culo. Reducci n de intensidad de deshoje e incrementos en la densidad de plantas (control de enfermedades de suelo) para incrementar rea foliar. Aumentar intercepci n de radiaci n en el ciclo 30 Rendimiento de tomate (kg m-2) mejorar la 20 Mejorar manejo para cada nivel de radiaci n 10 Ajuste de nutrici n: K y N. Mejora del riego. Plantines m s altos (oto o). Control de mosca blanca. Incrementar materia org nica en suelo y reducir Na intercambiable. 0 400 1000 1600 Radiaci n interceptada a lo largo del ciclo (MJ m-2)
Results and conclusions reached by this study allowed us to Deliver timely, relevant, and actionable information to better inform discussions among farmers and their technical advisors and contribute to reduce knowledge gaps. Better targeting of recommendations to improve crop performance in different situations. 5 workshops with farmers (70), technical advisors (15) and researchers (8) to discuss the main results and the applicability of different management practices, in the context of the farms, considering constraints and interaction at farm scale.
Thanks for the attention! cberrueta@inia.org.uy
