Linear Programming

Linear Programming
Water Resources Planning and
Management
Daene McKinney
General Constrained Optimization Model
•
n
decision-variables
x
j
and
m
constraints
Maximize (or minimize)
F
(
X
)
subject to
g
i
(
X
) =
b
i
,
i
= 1, 2, 3, … ,
m
X
is the vector of all
x
j
Linear Programming Model
•
If the objective function
F
(
X
) is linear and
•
If all the constraints
g
i
(
X
) are linear
•
Then the model becomes a linear programming model
•
The general structure of a linear programming model is:
Maximize (or minimize) Σ
j
n
P
j
x
j
Subject to:
Σ
j
n
a
ij
x
j
≤
b
i
for
i
= 1, 2, 3, … ,
m
x
j
≥ 0 for all
j
= 1, 2, 3, … ,
n
Yield
•
Yield
- amount of water that can be supplied during
some time interval
•
Firm yield
- amount of water that can be supplied in
a
critical period
–
Without storage: firm yield is lowest streamflow on record,
–
With storage: firm yield can be increased to approximately
the mean annual flow of stream
Regulation and Storage
•
Critical period
- period of lowest flow on record
–
“
having observed an event in past, it is possible to
experience it again in future
”
•
Storage
must be provided to deliver additional water
over total streamflow record
•
Given target yield, required capacity depends on risk
that yield will not be delivered, i.e., the
reliability
of
the system
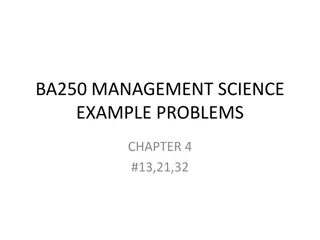
Storage Capacity – Yield Function
•
Maximum constant ‘dependable’
reservoir release or yield
available during each period of
operation, as a function of the
active storage volume capacity
•
The yield from any reservoir
depends on the active storage
capacity and the inflow
Two storage–yield functions for a single
reservoir defining the maximum minimum
dependable release. These functions can be
defined for varying levels of yield reliability.
Increasing Yield – Add Storage
•
Consider a sequence of 5 annual flows, say 2, 4, 1, 5 and 3, at a site in an
unregulated stream.
•
The minimum ‘dependable’ annual flow yield of the stream at that site is
1, the minimum observed flow.
•
A discharge of 1 can be ‘guaranteed’ in each of the five time-periods of
record.
•
If a reservoir with an active storage capacity of 1 is built, it could store 1
unit of flow when the flow ≥ 2, and then release it when the flow is 1,
increasing the minimum dependable flow to 2 units
•
Similarly, a yield of 3 could be attained in each time period with 2 units of
active capacity
•
The maximum annual yield cannot exceed the mean annual flow, which in
this example is 3.
Linear Programming for Deriving
Storage – Yield Functions
•
Consider a single reservoir that must provide a minimum release or yield
Y
in each period
t
.
•
Assume a record of known streamflows at the reservoir site is available.
•
The problem is to find the maximum uniform yield
Y
obtainable from a
given active storage capacity,
K
Maximize Y
Subject to
S
t
+
Q
t
-
Y
-
R
t
=
S
t
+1
t
= 1, 2, 3,
…,
T; T
+1 = 1
S
t
≤
K
t
= 1, 2, 3,
…,
T
•
The model must be solved for various assumed values of capacity
K
.
•
Only the inflow values
Q
t
and reservoir active storage capacity
K
are
known. All other storage, release and yield variables are unknown.
•
The upper bound on the yield, regardless of reservoir capacity, will be the
mean inflow
Max Y GAMS Code
Max Y Result
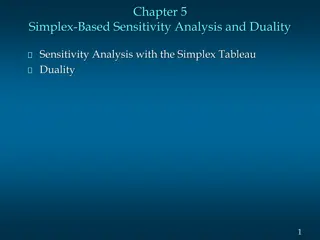
Capacity – Yield Function
Given a yield Y, what is the minimium
capacity K we need?
Given
Find
Water Quality Management
•
Critical component of overall water management in a basin
•
Water bodies serve many uses, including
–
Transport and assimilation of wastes
–
Assimilative capacities of water bodies can be exceeded WRT intended
uses
•
Water quality management measures
–
Standards
•
Minimum acceptable levels of ambient water quality
–
Actions
•
Insure pollutant load does not exceed assimilative capacity while
maintaining quality standards
–
Treatment
Water Quality Management Process
•
Identify
–
Problem
–
Indicators
–
Target Values
•
Assess source(s)
•
Determine linkages
–
Sources
Targets
•
Allocate permissible
loads
•
Monitor and evaluate
•
Implement
Water Quality Model Calibration Example
•
The stream receives wastewater effluent from two point sources (Sites 1 and 2)
•
Without some treatment at these sites, the concentration of some pollutant,
P
j
mg/l, at sites
j
= 2 and 3, will continue to exceed the maximum allowed
concentration
Pj
Max
•
The problem is to find the level of wastewater treatment (waste removed) at
sites
i
= 1 and 2 that will achieve the required concentrations at sites
j
= 2 and 3
at minimum cost
Simple model to predict
concentrations in a stream
•
P
=
concentration at site
j
(M/L
3
)
•
Q
j
= streamflow at site
j
(L
3
/T)
•
Mass in the stream will decrease as it travels downstream
•
The fraction
a
ij
of the mass at Site
i
that reaches Site
j
is:
a
ij
= exp(
ktij
)
•
where
k
is a rate constant (1/T)
tij
is the travel time (T) from Site
i
to Site
j
•
So
P
2
(just upstream of Site 2) =
P
1
a
12
P
3
(just upstream of Site 3) =
P
2
+
a
23
Model Calibration
•
SP
1
s
SP
2
s
= concentration of sample
s
in reaches 1 and 2
•
E
s
=
error
SP
2
s
+
E
s
=
SP
1
s
a
12
(
Q
1
/
Q
2
)
•
Objective - Minimize sum of absolute values of error terms
E
s
Minimize Σ
s
|
E
s
|
•
Software can’t handle absolute values, so convert
Minimize Σ
s
(
PE
s
+
NE
s
)
•
That is
E
s
=
PE
s
–
NE
s
,
where
PE
s
≥ 0, and
Ne
s
≥ 0
If
E
s
< 0,
PE
s
= 0 and -
NE
s
=
E
s
If
E
s
> 0,
PE
s
=
E
s
and
NE
s
= 0
Model
Minimize Σ
s
(
PE
s
+
NE
s
)
Subject to
SP
2s
+
E
s
=
SP
1
s
a
12
(
Q
1
/
Q
2
),
s
= 1, 2, 3,
…,
S
E
s
=
PE
s
–
NE
s
s
= 1, 2, 3,
…,
S
PE
s
≥ 0,
NE
s
≥ 0
s
= 1, 2, 3,
…,
S
Model
GAMS Code
Solution
Water Quality Management Model Example
•
W
1,
W
2
=
Pollutant loads (kg/day)
•
x
1
,
x
2
= Waste removal efficiencies (%)
•
P
2
max
,
P
3
max
= Water quality standards (mg/l)
•
P
2
,
P
3
= Concentrations (mg/l)
•
Q
1
,
Q
2
,
Q
3
= Flows (m
3
/sec)
•
a
12
,
a
13
,
a
23
, = Transfer coefficients
Water Quality Example
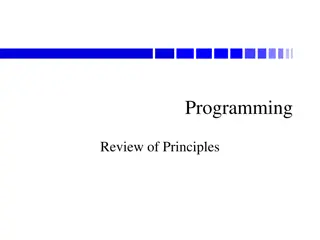
Cost Functions
General form of total cost
functions for
wastewater treatment
efficiencies at Sites 1 and 2.
Slopes c
1
and c
2
are the
average cost per unit (%)
removal for 80% treatment.
Water Quality Example
Water Quality Example
Water Quality Example
Cost of treatment at 1 > cost at 2
c
1
, > c
2
, for the same treatment
Water Quality Example
Example
•
Irrigation project
–
1800 acre-feet of water per year
•
Decision variables
–
x
A
= acres of Crop A to plant?
–
x
B
= acres of Crop B to plant?
1,800 acre feet = 2,220,267 m
3
400 acre = 1,618,742 m
2
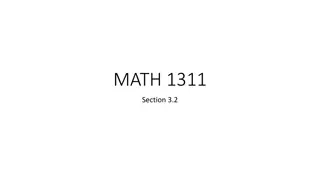
Example
2
4
6
8
1
0
2
4
6
8
1
0
x
A
(
h
u
n
d
r
e
d
s
a
c
r
e
s
)
x
B
(
h
u
n
d
r
e
d
s
a
c
r
e
s
)
x
B
<
6
0
0
x
A
>
0
x
A
<
4
0
0
3
x
A
+
2
x
B
<
1
8
0
0
x
B
>
0
Example
2
4
6
8
1
0
2
4
6
8
1
0
x
A
(
h
u
n
d
r
e
d
s
a
c
r
e
s
)
x
B
(
h
u
n
d
r
e
d
s
a
c
r
e
s
)
x
B
<
6
0
0
x
A
>
0
x
A
<
4
0
0
x
B
>
0
Z
=
3
6
0
0
=
3
0
0
x
A
+
5
0
0
x
B
Z
=
2
0
0
0
=
3
0
0
x
A
+
5
0
0
x
B
Z
=
1
0
0
0
=
3
0
0
x
A
+
5
0
0
x
B
(
2
0
0
,
6
0
0
)
GAMS Code
POSITIVE VARIABLES xA, xB;
VARIABLES Z;
EQUATIONS objective, xAup, xBup, limit;
objective.. Z =E= 300*xA+500*xB;
xAup.. xA =L= 400.;
xBup.. xB =L= 600.;
limit.. 3*xA+2*xB =L= 1800;
MODEL Farm / ALL /;
SOLVE Farm USING LP MAXIMIZING obj;
Display xA.l;
Display xB.l;
GAMS Output
LOWER LEVEL UPPER MARGINAL
---- EQU objective . . . 1.000
---- EQU xAup -INF 200.000 400.000 .
---- EQU xBup -INF 600.000 600.000 300.000
---- EQU limit -INF 1800.000 1800.000 100.000
LOWER LEVEL UPPER MARGINAL
---- VAR xA . 200.000 +INF .
---- VAR xB . 600.000 +INF .
---- VAR obj -INF 3.6000E+5 +INF .
Marginal
Marginals
•
Marginal for a constraint = Change in
the objective per unit increase in RHS
of that constraint.
–
i.e., change
x
B
–
Objective = 360,000
–
Marginal for constraint = 300
–
Expect new objective value = 360,300
New Solution
L
O
W
E
R
L
E
V
E
L
U
P
P
E
R
M
A
R
G
I
N
A
L
-
-
-
-
E
Q
U
o
b
j
e
c
t
i
v
e
.
.
.
1
.
0
0
0
-
-
-
-
E
Q
U
x
A
u
p
-
I
N
F
1
9
9
.
3
3
3
4
0
0
.
0
0
0
.
-
-
-
-
E
Q
U
x
B
u
p
-
I
N
F
6
0
1
.
0
0
0
6
0
1
.
0
0
0
3
0
0
.
0
0
0
-
-
-
-
E
Q
U
l
i
m
i
t
-
I
N
F
1
8
0
0
.
0
0
0
1
8
0
0
.
0
0
0
1
0
0
.
0
0
0
L
O
W
E
R
L
E
V
E
L
U
P
P
E
R
M
A
R
G
I
N
A
L
-
-
-
-
V
A
R
x
A
.
1
9
9
.
3
3
3
+
I
N
F
.
-
-
-
-
V
A
R
x
B
.
6
0
1
.
0
0
0
+
I
N
F
.
-
-
-
-
V
A
R
o
b
j
-
I
N
F
3
.
6
0
3
0
E
+
5
+
I
N
F
.
N
o
t
e
:
A
d
d
i
n
g
1
u
n
i
t
t
o
x
B
a
d
d
s
3
0
0
t
o
t
h
e
o
b
j
e
c
t
i
v
e
,
b
u
t
c
o
n
s
t
r
a
i
n
t
3
s
a
y
s
a
n
d
t
h
i
s
c
o
n
s
t
r
a
i
n
t
i
s
“
t
i
g
h
t
”
(
n
o
s
l
a
c
k
)
s
o
i
t
h
o
l
d
s
a
s
a
n
e
q
u
a
l
i
t
y
,
t
h
e
r
e
f
o
r
e
x
A
m
u
s
t
d
e
c
r
e
a
s
e
b
y
1
/
3
u
n
i
t
f
o
r
x
B
t
o
i
n
c
r
e
a
s
e
b
y
a
u
n
i
t
.
Unbounded Solution
2
4
6
8
1
0
2
4
6
8
1
0
x
A
(
h
u
n
d
r
e
d
s
a
c
r
e
s
)
x
B
(
h
u
n
d
r
e
d
s
a
c
r
e
s
)
x
A
>
0
x
A
<
4
0
0
x
B
>
0
u
n
b
o
u
n
d
e
d
T
a
k
e
o
u
t
c
o
n
s
t
r
a
i
n
t
s
3
a
n
d
4
,
o
b
j
e
c
t
i
v
e
c
a
n
I
n
c
r
e
a
s
e
w
i
t
h
o
u
t
b
o
u
n
d
Infeasibility
2
4
6
8
1
0
2
4
6
8
1
0
x
A
(
h
u
n
d
r
e
d
s
a
c
r
e
s
)
x
B
(
h
u
n
d
r
e
d
s
a
c
r
e
s
)
x
B
<
6
0
0
x
A
>
0
x
A
<
4
0
0
3
x
A
+
2
x
B
>
3
0
0
0
x
B
>
0
C
h
a
n
g
e
c
o
n
s
t
r
a
i
n
t
4
t
o
>
=
3
0
0
0
,
t
h
e
n
n
o
i
n
t
e
r
s
e
c
t
i
o
n
o
f
c
o
n
s
t
r
a
i
n
t
s
e
x
i
s
t
s
a
n
d
n
o
f
e
a
s
i
b
l
e
s
o
l
u
t
i
o
n
c
a
n
b
e
f
o
u
n
d
Multiple Optima
C
h
a
n
g
e
o
b
j
e
c
t
i
v
e
c
o
e
f
f
i
c
i
e
n
t
t
o
2
0
0
,
t
h
e
n
o
b
j
e
c
t
i
v
e
h
a
s
s
a
m
e
s
l
o
p
e
a
s
c
o
n
s
t
r
a
i
n
t
a
n
d
i
n
f
i
n
i
t
e
s
o
l
u
t
i
o
n
s
e
x
i
s
t
2
4
6
8
1
0
2
4
6
8
1
0
x
A
(
h
u
n
d
r
e
d
s
a
c
r
e
s
)
x
B
(
h
u
n
d
r
e
d
s
a
c
r
e
s
)
x
B
<
6
0
0
x
A
>
0
x
A
<
4
0
0
x
B
>
0
Z
=
1
8
0
0
=
3
0
0
x
A
+
2
0
0
x
B
I
n
f
i
n
i
t
e
s
o
l
u
t
i
o
n
s
o
n
t
h
i
s
e
d
g
e
3
x
A
+
2
x
B
<
1
8
0
0
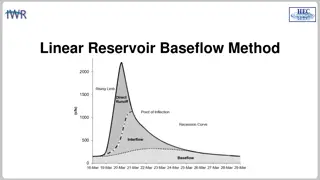
Water resources planning and management involve utilizing linear programming models to optimize decision-making for water allocation, storage, and yield. This involves constraints such as maximizing or minimizing objectives subject to linear equations. Firm yield and storage capacity play critical roles in ensuring reliable water supply even during low flow periods. Through storage capacity yield functions and the incorporation of reservoirs, water resources systems can increase their yield and reliability.

Download Presentation

Please find below an Image/Link to download the presentation.
The content on the website is provided AS IS for your information and personal use only. It may not be sold, licensed, or shared on other websites without obtaining consent from the author.If you encounter any issues during the download, it is possible that the publisher has removed the file from their server.
You are allowed to download the files provided on this website for personal or commercial use, subject to the condition that they are used lawfully. All files are the property of their respective owners.
The content on the website is provided AS IS for your information and personal use only. It may not be sold, licensed, or shared on other websites without obtaining consent from the author.
E N D
Presentation Transcript
Linear Programming Water Resources Planning and Management Daene McKinney
General Constrained Optimization Model n decision-variables xjand m constraints Maximize (or minimize) F(X) subject to gi(X) = bi, i = 1, 2, 3, , m X is the vector of all xj
Linear Programming Model If the objective function F(X) is linear and If all the constraints gi(X) are linear Then the model becomes a linear programming model The general structure of a linear programming model is: Maximize (or minimize) jnPjxj Subject to: jnaijxj bi xj 0 for all j = 1, 2, 3, , n for i = 1, 2, 3, , m
Yield Yield - amount of water that can be supplied during some time interval Firm yield - amount of water that can be supplied in a critical period Without storage: firm yield is lowest streamflow on record, With storage: firm yield can be increased to approximately the mean annual flow of stream
Regulation and Storage Critical period - period of lowest flow on record having observed an event in past, it is possible to experience it again in future Storage must be provided to deliver additional water over total streamflow record Given target yield, required capacity depends on risk that yield will not be delivered, i.e., the reliability of the system
Storage Capacity Yield Function Maximum constant dependable reservoir release or yield available during each period of operation, as a function of the active storage volume capacity The yield from any reservoir depends on the active storage capacity and the inflow Two storage yield functions for a single reservoir defining the maximum minimum dependable release. These functions can be defined for varying levels of yield reliability.
Increasing Yield Add Storage Consider a sequence of 5 annual flows, say 2, 4, 1, 5 and 3, at a site in an unregulated stream. The minimum dependable annual flow yield of the stream at that site is 1, the minimum observed flow. A discharge of 1 can be guaranteed in each of the five time-periods of record. If a reservoir with an active storage capacity of 1 is built, it could store 1 unit of flow when the flow 2, and then release it when the flow is 1, increasing the minimum dependable flow to 2 units Similarly, a yield of 3 could be attained in each time period with 2 units of active capacity The maximum annual yield cannot exceed the mean annual flow, which in this example is 3.
Linear Programming for Deriving Storage Yield Functions Consider a single reservoir that must provide a minimum release or yield Y in each period t. Assume a record of known streamflows at the reservoir site is available. The problem is to find the maximum uniform yield Y obtainable from a given active storage capacity, K Maximize Y Subject to St+ Qt- Y - Rt= St+1 t = 1, 2, 3, , T; T+1 = 1 St K t = 1, 2, 3, , T The model must be solved for various assumed values of capacity K. Only the inflow values Qt and reservoir active storage capacity K are known. All other storage, release and yield variables are unknown. The upper bound on the yield, regardless of reservoir capacity, will be the mean inflow St Y Qt Rt K
Max Y Result t t 1 2 3 4 5 Inflow Q(t) 10 5 30 20 15 Storage S(t) 10 7.5 0 10 10 Release R(t) 0 0 7.5 7.5 12.5 Yield Y 12.5 12.5 12.5 12.5 12.5 Yield Capacity 12.5 10 35? 30? 25? Q(t)? 20? S(t)? 15? R(t)? Y? 10? 5? 0? 1? 2? 3? 4? 5?
Capacity Yield Function 18? K 0 5 10 15 18 Y 5 10 12.5 15 16 16? 14? 12? Yield,? Y? 10? 8? 6? 4? 2? 0? 0? 2? 4? 6? 8? 10? 12? 14? 16? 18? Capacity,? K?
Given a yield Y, what is the minimium capacity K we need? Minimize subject to K Given Find Y K St+1=St+Qt-(Rt+Y) t =1,...,T; T +1=1 St K 1.0 t =1,...,T 1.5 2.0 2.5 St 3.0 Y Qt Rt 4.0 K
Water Quality Management Critical component of overall water management in a basin Water bodies serve many uses, including Transport and assimilation of wastes Assimilative capacities of water bodies can be exceeded WRT intended uses Water quality management measures Standards Minimum acceptable levels of ambient water quality Actions Insure pollutant load does not exceed assimilative capacity while maintaining quality standards Treatment
Water Quality Management Process Identify Problem Indicators Target Values Assess source(s) Determine linkages Sources Targets Allocate permissible loads Monitor and evaluate Implement
Water Quality Model Calibration Example The stream receives wastewater effluent from two point sources (Sites 1 and 2) Without some treatment at these sites, the concentration of some pollutant, Pj mg/l, at sites j = 2 and 3, will continue to exceed the maximum allowed concentration PjMax The problem is to find the level of wastewater treatment (waste removed) at sites i = 1 and 2 that will achieve the required concentrations at sites j = 2 and 3 at minimum cost
Simple model to predict concentrations in a stream P = concentration at site j (M/L3) Qj = streamflow at site j (L3/T) Mass in the stream will decrease as it travels downstream The fraction aij of the mass at Site i that reaches Site j is: aij = exp(ktij) where k is a rate constant (1/T) tij is the travel time (T) from Site i to Site j So P2 (just upstream of Site 2) = P1a12 P3 (just upstream of Site 3) = P2+a23
Model Calibration SP1sSP2s = concentration of sample s in reaches 1 and 2 Es = error SP2s + Es = SP1sa12(Q1/Q2) Objective - Minimize sum of absolute values of error terms Es Minimize s| Es| Software can t handle absolute values, so convert Minimize s(PEs + NEs) That is Es = PEs NEs, where PEs 0, and Nes 0 If Es < 0, PEs = 0 and -NEs = Es If Es > 0, PEs = Es and NEs = 0
Model Minimize s(PEs + NEs) Subject to SP2s + Es = SP1sa12(Q1/Q2), s = 1, 2, 3, , S Es = PEs NEs s = 1, 2, 3, , S PEs 0, NEs 0 s = 1, 2, 3, , S
Model Solution GAMS Code
Water Quality Management Model Example W1,W2 = Pollutant loads (kg/day) x1, x2 = Waste removal efficiencies (%) P2max, P3max = Water quality standards (mg/l) P2, P3 = Concentrations (mg/l) Q1, Q2,Q3= Flows (m3/sec) a12, a13, a23, = Transfer coefficients
Water Quality Example Minimize Z = C1(x1)+C2(x2) Subjectto maxorP1Q1+W1(1- x1) [ ]a12 max P2 P2 P2 Q2 [ ]a13+ W2(1- x2) [ Q3 ]a23 maxorP1Q1+W1(1- x1) max P3 P3 P3 0 xi 1 i=1,2
Cost Functions General form of total cost functions for wastewater treatment efficiencies at Sites 1 and 2. Slopes c1 and c2 are the average cost per unit (%) removal for 80% treatment.
Water Quality Example Paramet er Units Value m3/s Q1 Q2 Q3 W1 W2 P1 P2max P3max a12 a13 a23 10 m3/s 12 Minimize C1(x1)+C2(x2) Subjectto x1 0.8 x1+1.28x2 1.79 0.0 xi 1.0 m3/s 13 kg/day 250,000 kg/day 80,000 mg/l 32 i=1,2 mg/l 20 mg/l 20 - 0.25 - 0.15 - 0.60
Water Quality Example Minimize Z = C1(x1)+C2(x2) Subjectto x1 0.8 x1+1.28x2 1.79 0.0 xi 1.0 . 1 + . 1 1 x 2 x 28 79 x x 0 . 1 0 . 1 1 2 i=1,2 1 x 8 . 0
Water Quality Example + Minimize c x c x 1 1 2 2 Cost of treatment at 1 > cost at 2 Subject to c1, > c2, for the same treatment 8 . 0 x 1 + . 1 . 1 28 x i 79 x x 1 2 0 . 1 2 , 1 = 0 . 0 i
Water Quality Example Minimize Z = c1x1+c2x2 Subjectto x1 0.8 x1+1.28x2 1.79 0.0 x1 1.0 0.0 x2 1.0 c1 c2 c1>c2 c1= c2 c1= c2
Example Irrigation project 1800 acre-feet of water per year Crop A Crop B Water requirement (Acre feet/acre) 3 2 Profit ($/acre) 300 500 Max area (acres) 400 600 Decision variables xA = acres of Crop A to plant? xB = acres of Crop B to plant? 1,800 acre feet = 2,220,267 m3 400 acre = 1,618,742 m2
Example Maximize Z = 300xA+500xB Subjectto xA 400 xB 600 3xA+2xB 1800 xA 0 xB< 600 xA< 400 xA> 0 10 xB (hundreds acres) xB 0 8 6 4 3xA +2 xB < 1800 2 xB > 0 2 4 6 8 10 xA (hundreds acres)
Example Objective Z = 300xA+500xB xA< 400 xA> 0 10 Z=3600=300xA +500xB (200, 600) xB (hundreds acres) 8 xB< 600 6 Z=2000=300xA +500xB 4 Z=1000=300xA +500xB 2 xB > 0 2 4 6 8 10 xA (hundreds acres)
GAMS Code POSITIVE VARIABLES xA, xB; VARIABLES Z; EQUATIONS objective, xAup, xBup, limit; objective.. Z =E= 300*xA+500*xB; xAup.. xA =L= 400.; xBup.. xB =L= 600.; limit.. 3*xA+2*xB =L= 1800; MODEL Farm / ALL /; SOLVE Farm USING LP MAXIMIZING obj; Display xA.l; Display xB.l;
GAMS Output LOWER LEVEL UPPER MARGINAL ---- EQU objective . . . 1.000 ---- EQU xAup -INF 200.000 400.000 . ---- EQU xBup -INF 600.000 600.000 300.000 ---- EQU limit -INF 1800.000 1800.000 100.000 LOWER LEVEL UPPER MARGINAL ---- VAR xA . 200.000 +INF . ---- VAR xB . 600.000 +INF . ---- VAR obj -INF 3.6000E+5 +INF . Marginal
Marginals Marginal for a constraint = Change in the objective per unit increase in RHS of that constraint. i.e., change xB Objective = 360,000 Marginal for constraint = 300 Expect new objective value = 360,300 600 x 601 x B B
New Solution LOWER LEVEL UPPER MARGINAL ---- EQU objective . . . 1.000 ---- EQU xAup -INF 199.333 400.000 . ---- EQU xBup -INF 601.000 601.000 300.000 ---- EQU limit -INF 1800.000 1800.000 100.000 LOWER LEVEL UPPER MARGINAL ---- VAR xA . 199.333 +INF . ---- VAR xB . 601.000 +INF . ---- VAR obj -INF 3.6030E+5 +INF . Note: Adding 1 unit to xB adds 300 to the objective, but constraint 3 says + 3 2 1800 x x A B and this constraint is tight (no slack) so it holds as an equality, therefore xA must decrease by 1/3 unit for xB to increase by a unit.
Unbounded Solution Take out constraints 3 and 4, objective can Increase without bound xA< 400 xA> 0 10 = + Maximize 300 500 Z x x A B xB (hundreds acres) Subject to unbounded 8 400 x A 6 0 0 x x A B 4 2 xB > 0 2 4 6 8 10 xA (hundreds acres)
Infeasibility Change constraint 4 to >= 3000, then no intersection of constraints exists and no feasible solution can be found xA< 400 xA> 0 10 3xA +2 xB > 3000 xB (hundreds acres) 8 = + Maximize 300 500 Z x x A B xB< 600 6 Subject to 400 x A 4 600 + x B x 2 3 x 2 3000 x A B x xB > 0 0 0 A B 2 4 6 8 10 xA (hundreds acres)
Multiple Optima = + Objective 300 200 Z x x A B xA< 400 xA> 0 10 Infinite solutions on this edge xB (hundreds acres) 8 Z=1800=300xA +200xB xB< 600 6 Change objective coefficient to 200, then objective has same slope as constraint and infinite solutions exist 4 3xA +2 xB < 1800 2 xB > 0 2 4 6 8 10 xA (hundreds acres)