Parametric Sensitivity Analysis
In a Silicon-Fab environment, the Parametric Sensitivity Analysis (PSA) algorithm is utilized to determine key performance indicators affecting wafer yield. This method helps identify important predictors amidst noise and outliers in the data, providing a ranked list based on R2 values and P-values. By utilizing JMP scripting, the process is automated, enabling efficient analysis of electrical and functional measurements collected for silicon wafers. The methodology involves grouping data, calculating means/medians, and evaluating correlations to enhance the understanding of yield modulators. Explore the visualization of results to enhance decision-making and improve yield outcomes.
Download Presentation

Please find below an Image/Link to download the presentation.
The content on the website is provided AS IS for your information and personal use only. It may not be sold, licensed, or shared on other websites without obtaining consent from the author.If you encounter any issues during the download, it is possible that the publisher has removed the file from their server.
You are allowed to download the files provided on this website for personal or commercial use, subject to the condition that they are used lawfully. All files are the property of their respective owners.
The content on the website is provided AS IS for your information and personal use only. It may not be sold, licensed, or shared on other websites without obtaining consent from the author.
E N D
Presentation Transcript
Parametric Sensitivity Analysis Identify in a big mass of data the significant predictors of the Probe wafer yield by using JMP scripting
Parametric Sensitivity Analysis Gianpaolo Polsinelli, Felice Russo LFoundry s.r.l Italy a Smic Company Abstract Objective In a Silicon-Fab several electrical and functional measurements are collected for each single silicon wafer. So it is very important to identify in a big mass of data which variables are really modulating the wafer yield the most important key performance indicator. Usually a scatter plot with a linear regression fit is used for that. Anyway this technique works well only if distributions are normal, in absence of outliers and data noisy. All those factors can obscure the true s relationship between yield loss and in line issues. To determine how different values of a predictor variable impact the wafer yield. Identify the right candidates by using Parametric Sensitivity Analysis (PSA) algorithm. JMP Script to automate the entire process.
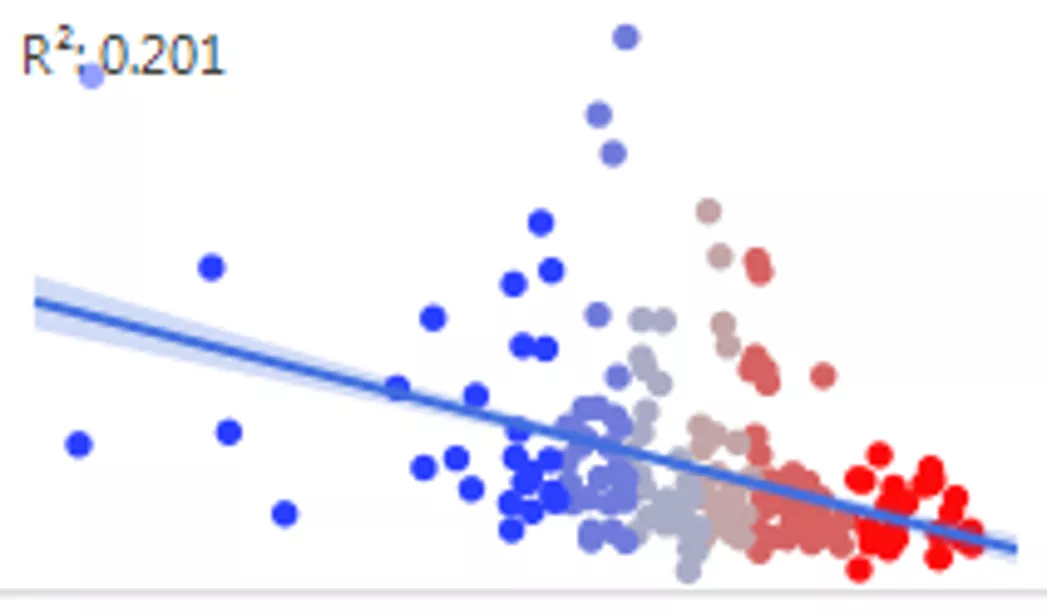
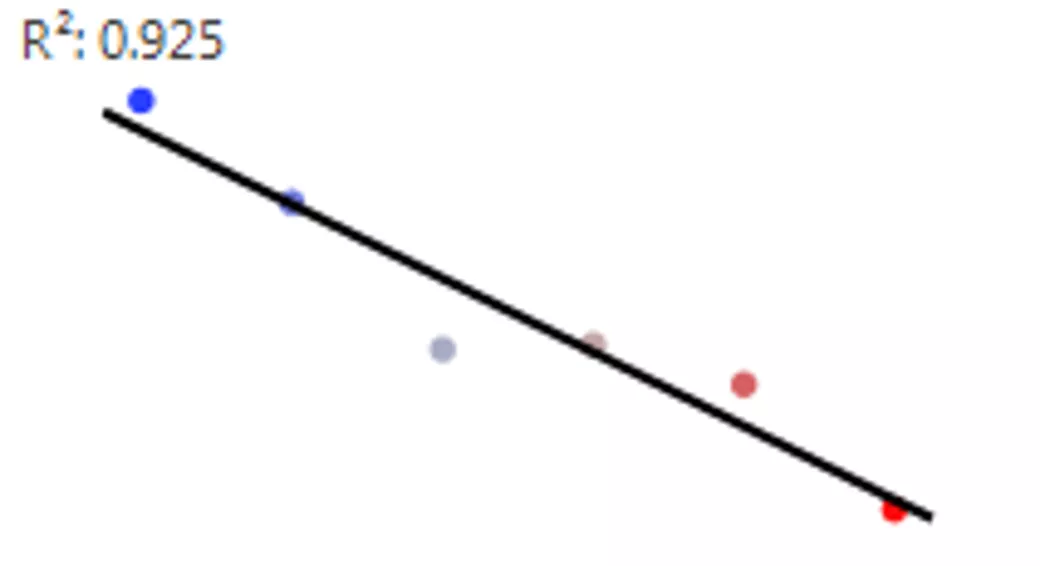
Parametric Sensitivity Analysis Gianpaolo Polsinelli, Felice Russo LFoundry s.r.l Italy a Smic Company Methodology The linear fit R2 is then calculated using mean and/or median of groups instead of raw data points. Besides R2 value the P-Val is evaluated too. A table with predictors ranked by a decreasing R2 value is generated. Scatter plot for Yield vs. Predictor1 The PSA technique is used when data are very noisy and contain confounding effects. The response distribution is divided in N different balanced groups and a label is assigned to all database rows. For each group the predictors mean and/or median is calculated. Grp 6 Grp1 Scatter plot for Yield vs. Predictor2 Gr 2 Gr 3Gr 4 Gr 5 Gr 6 Gr 1 Predictor2 by Group (NO correlation is visible ) Predictor1 by Group ( A correlation is visible) Response by Group
Parametric Sensitivity Analysis Gianpaolo Polsinelli, Felice Russo LFoundry s.r.l Italy a Smic Company FAB Data: Not normal distributions, long tails, fliers Raw Data FAB Data: Not normal distributions, long tails, fliers . . . . . . Parametric Sensitivity Analysis Correlations Parametric Sensitivity Analysis Output ranked by R2 Output ranked Result by R2
Parametric Sensitivity Analysis Gianpaolo Polsinelli, Felice Russo LFoundry s.r.l Italy a Smic Company Input GUI Output Table Graph Builder To notice the strong improvement of R2 value.
