Understanding Correlation Strength in Data Representation
Explore different types of correlations in data representation through various examples. Learn to identify positive, negative, or no correlation, and determine the strength - whether weak, moderate, or strong. Visualize correlations through graphs and understand the implications for data analysis and interpretation.

Uploaded on Sep 30, 2024 | 0 Views
Download Presentation

Please find below an Image/Link to download the presentation.
The content on the website is provided AS IS for your information and personal use only. It may not be sold, licensed, or shared on other websites without obtaining consent from the author. Download presentation by click this link. If you encounter any issues during the download, it is possible that the publisher has removed the file from their server.
E N D
Presentation Transcript
CHAPTER 23 Statistics II Representing Data Solutions: Practice Questions 23.6
23 Practice Questions 23.6 1. Determine whether each of the following represents a positive, negative or no correlation and determine the strength (strong, moderate, weak) for each: (i) Weak negative correlation since the points are decreasing from left to right but are not close to a straight line.
23 Practice Questions 23.6 1. Determine whether each of the following represents a positive, negative or no correlation and determine the strength (strong, moderate, weak) for each: (ii) No correlation since the points are randomly spread out on the graph.
23 Practice Questions 23.6 1. Determine whether each of the following represents a positive, negative or no correlation and determine the strength (strong, moderate, weak) for each: (iii) Strong negative correlation. The line is almost straight so almost a perfect correlation.
23 Practice Questions 23.6 1. Determine whether each of the following represents a positive, negative or no correlation and determine the strength (strong, moderate, weak) for each: (iv) Weak positive correlation since the points are increasing from left to right but not close to a straight line.
23 Practice Questions 23.6 1. Determine whether each of the following represents a positive, negative or no correlation and determine the strength (strong, moderate, weak) for each: (v) Moderate positive correlation since the points are increasing from left to right and are getting close to a straight line.
23 Practice Questions 23.6 1. Determine whether each of the following represents a positive, negative or no correlation and determine the strength (strong, moderate, weak) for each: (vi) Moderate negative correlation since the points are decreasing from left to right and are getting close to a straight line.
23 Practice Questions 23.6 1. Determine whether each of the following represents a positive, negative or no correlation and determine the strength (strong, moderate, weak) for each: (vii) Strong positive correlation, in fact since the points form a straight line increasing from left to right this is a perfect positive correlation.
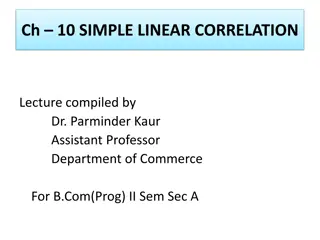
23 Practice Questions 23.6 2. Match the correlation coefficient to the scatterplot. r = 0 (i) B A r = 0 9 (ii) r = 0 3 (iii) C D r = 0 8 (iv) r = 0 6 (v) E F r = 0 2 (vi)
23 Practice Questions 23.6 2. Match the correlation coefficient to the scatterplot. r = 0 (i) C : (i) r = 0 no correlation B A (ii) B : (ii) r = 0 9 strong negative r = 0 9 (iii) D : (iii) r= 0 3 weak positive r = 0 3 C D r = 0 8 (iv) A : (iv) r= 0 8 strong positive (v) E : (v) r = 0 6 moderate negative r = 0 6 E F (vi) F : (vi) r = 0 2 weak negative r = 0 2
23 Practice Questions 23.6 3. Suggest a value for the correlation coefficient in each of the following: Perfect negative correlation. (i) r = 1 Weak positive correlation. (ii) r = 0 2 Strong negative correlation. (iii) r = 0 8 Moderate positive correlation. (iv) r = 0 5
23 Practice Questions 23.6 4. Estimate the correlation coefficient for each of the following pairs of variables: Distance travelled and time spent travelling. (i) r = 1. This is a perfect positive correlation because the longer you travel for the further you will travel. Millimetres of rain and number of umbrellas seen. (ii) r = 0 5. This is a moderate positive relationship because the more it rains the more umbrellas you are likely to see but not everyone will use an umbrella in the rain.
23 Practice Questions 23.6 4. Estimate the correlation coefficient for each of the following pairs of variables: Temperature and litres of heating oil used. (iii) r = 0 8. This is a strong negative relationship because as the temperature decreases the litres of heating oil being used will increase as people try to stay warm. Height and maths result. (iv) r = 0. The is no correlation between your height and how good you are at maths.
23 Practice Questions 23.6 4. Estimate the correlation coefficient for each of the following pairs of variables: Balance left on a gift card and cost of purchases made with the card. (v) r = 1. This is a perfect negative correlation. As the number of purchases made on a gift card increases the balance left on the card decreases.
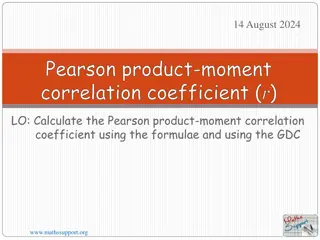
23 Practice Questions 23.6 5. In a recent maths test students were asked to fill in the number of hours they spent watching TV. The table shows the results of the test and the hours watching TV: Hrs? of? TV? 13? 15? 18? 22? 24? 16? 12? 8? 10? 11? 17? 9? 17? 21? 14? 7? 11? 18? 26? 12? Result? 78? 65? 56? 43? 48? 73? 75? 82? 53? 45? 69? 79? 97? 43? 88? 72? 40? 53? 38? 55? ? Draw a scatterplot to represent this data. (i)
23 Practice Questions 23.6 (ii) Does a correlation exist between hours spent watching TV and maths test result? 5. If yes, describe the correlation and estimate the correlation coefficient. Yes. There is a weak negative correlation. The points are tending to form a band that decreases from left to right. r = 0 2
23 Practice Questions 23.6 (iii) What does this correlation tell you about the relationship between the numbers of hours spent watching TV and the result obtained in a maths test? 5. Generally, students who watched large amounts of TV achieved lower grades in the maths test.