Understanding Regression Analysis in Statistical Research
Regression analysis, specifically focusing on the R2 statistic, is a method used to examine the relationship between two variables at an interval/ratio level. It evaluates how well a line fits the data and measures the strength of the relationship between independent and dependent variables. Being statistically significant in regression analysis does not imply practical significance. It's important to consider the correlation coefficient, slope, and R2 value to assess the relationship. Remember, correlation doesn't equate to causation.
Download Presentation

Please find below an Image/Link to download the presentation.
The content on the website is provided AS IS for your information and personal use only. It may not be sold, licensed, or shared on other websites without obtaining consent from the author. Download presentation by click this link. If you encounter any issues during the download, it is possible that the publisher has removed the file from their server.
E N D
Presentation Transcript
REGRESSION (R2)
Are INFERENTIAL STATISTIC TEST(S) applicable to this data? *REQUIREMENTS for ALL inferential statistic tests TWO or MORE EXPERIMENTAL GROUPS (control and one treatment, or two or more treatments) OUTPUT is CONTINUOUS DATA (INPUT may be categorical or continuous) COMPARE MEANS minimum of 15 TRIALS Which INFERENTIAL STATISTIC TEST(S) are applicable to this level of data? REGRESSION: BOTH INPUT and OUTPUT must be CONTINUOUS INTERVAL or RATIO DATA T-TEST: OUTPUT must be CONTINUOUS and INPUT may be CATEGORICAL or CONTINUOUS DATA CHI-SQUARE: BOTH INPUT and OUTPUT are CATEGORICAL DATA
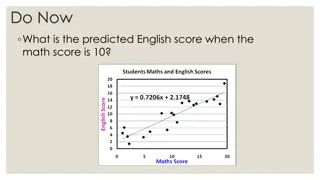
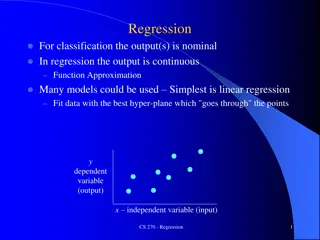
REGRESSION REGRESSION (R2) looking for the relationship between two variables tested multiple levels of those variables interval/ratio level data for both variables (independent & dependent) compares variables to check for a linear relationship between means estimates the strength of a relationship between independent and dependent variables calculates line of best fit between data points correlation coefficient (R2) measures how close line fits the data closest to +1 (direct relationship) or -1 (inverse relationship) measures the % of the variation in the dependent variable Y that is explained by the independent variable X
Statistically significant does NOT mean LARGE. Statistically significant practical significance or usefulness Statistically significant does mean there is evidence of a result in the population. Statistically significant does not mean there is a strong relationship between the (X) independent variable and the (Y) dependent variable. To examine the strength of a relationship between the (X) independent variable and the (Y) dependent variable we look at the slope, the correlation coefficient (how close the data points are to the fitted line) and the R2 value (how much of the change in (Y) dependent variable is explained by (X) independent variable. when two variables are correlated it does not mean that one causes the other. It means there is a linear relationship between the two variables. One might cause the other. (association causation)
