Understanding Scatter Plots and Trend Lines for Data Analysis
Scatter plots display data as ordered pairs to show relationships, while trend lines indicate correlation. Learn how to create scatter plots, interpret correlations, draw trend lines, and make predictions. Explore causation versus correlation and practice identifying causal relationships in various scenarios.

Download Presentation

Please find below an Image/Link to download the presentation.
The content on the website is provided AS IS for your information and personal use only. It may not be sold, licensed, or shared on other websites without obtaining consent from the author. Download presentation by click this link. If you encounter any issues during the download, it is possible that the publisher has removed the file from their server.
E N D
Presentation Transcript
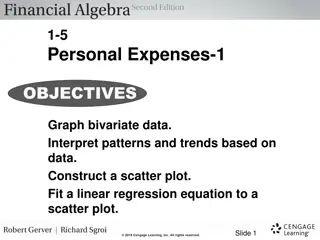
5-7 Scatter Plots and Trend Lines
Scatter Plot: A graph that relates two different sets of data by displaying them as ordered pairs
Trend Line: a line on a scatter plot, drawn near the points, that shows a correlation Interpolation: estimating a value between two know values Extrapolation: Predicting a value outside the range of known values
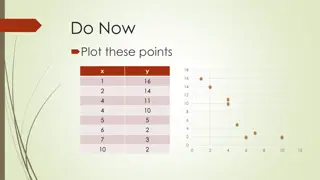
Problem 1/2: Making a Scatter Plot, Describing its Correlation, and making a trend line The table shows the altitude of an airplane and the temperature outside the plane. A) Make a scatter plot of the data B) What type of relationship does the scatter plot show? C) Draw the trend line and write the equation. D) Predict the temperature when the altitude is 7500
Plane Altitude and Outside Temperature 70 60 50 40 Temperature (F) 30 20 10 0 1000 2000 3000 4000 5000 Altitude (m)
Line of best fit: the trend that shows the relationship between two sets of data Causation: when a change in one quantity causes a change in a second quantity (a correlation between quantities does not always imply causation)
Problem 4: Identifying Whether Relationships are Causal In the following situations, is there likely to be a correlation? If so, does the correlation reflect a causal relationship? Explain? The number of loaves of bread baked and the amount of flour used
In the following situations, is there likely to be a correlation? If so, does the correlation reflect a causal relationship? Explain? The number of mailboxes and the number of firefighters in a city