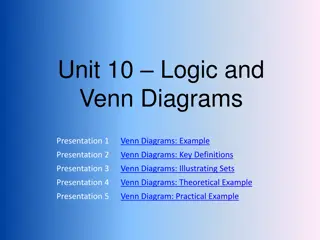
Comprehensive Guide to Venn Diagrams: Definition, History, Application, and Software
Venn diagrams illustrate relationships between sets using overlapping circles. They are versatile tools that aid in organizing abstract ideas across various disciplines. Learn about the history, applications, benefits, and user-friendly software for creating Venn diagrams efficiently. Explore examples like Animal Analysis to understand their practical usage.

Download Presentation

Please find below an Image/Link to download the presentation.
The content on the website is provided AS IS for your information and personal use only. It may not be sold, licensed, or shared on other websites without obtaining consent from the author. Download presentation by click this link. If you encounter any issues during the download, it is possible that the publisher has removed the file from their server.
E N D
Presentation Transcript
Text Text Text Venn Diagram Guide Text Text Text Text Text Text Text Text Text Text Created by Edraw - Comprehensive Diagramming Software Created by Edraw - Comprehensive Diagramming Software
CONTENTS 1 Definition of Venn Diagram 2 History of Venn Diagram 3 Application and Benefits of Venn Diagram 4 Venn Diagram Software 5 Venn Diagram Examples Created by Edraw - Comprehensive Diagramming Software
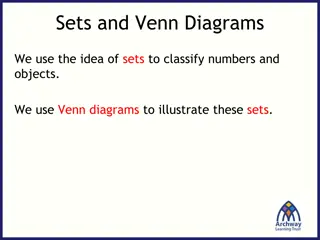
Definition of Venn Diagram Venn diagram is an illustration that uses overlapping or non-overlapping circles to show the relationship between a finite collection of sets. Where the circles overlap, items have a specified something in common. Some even refer to Venn diagrams as the overlapping circles charts or double bubbles charts. P Created by Edraw - Comprehensive Diagramming Software
Brief History of Venn Diagram John Venn presented his paper "On the Diagrammatic and Mechanical Representation of Propositions and Reasonings." This work ultimately secured his position as the namesake of Venn diagrams. "The Principles of Empirical Logic" 1991 1881 The term "Venn diagram" appears in "A Survey of Symbolic Logic" by Clarence Irving Lewis, published in 1918. 1889 Treatise "Symbolic Logic" 1880 P Created by Edraw - Comprehensive Diagramming Software
Application and Benefits of Venn Diagram Organize and present abstract ideas easily. Venn diagrams do not just restrict its use to classroom learning, but also used extensively in other disciplines. It's a great tool for organizing, evaluating and representing complex relationships visually. Venn diagrams are useful when it comes to making comparisons between groups of things. Venn diagrams are usually used for solving math problems which demand logical thinking and deductive reasoning Venn diagrams show relationships, clarify concepts, and facilitate communication. P Created by Edraw - Comprehensive Diagramming Software
Venn Diagram Software Ease of Use Similar interface with Word. Drag-and-Drop Predefined shapes in vector format. 100% Compatibility with MS Offices Export Venn diagrams as other formats with 1 click. Rich Templates and Examples Get started in the fastest way. Easy Editing Edit shapes through floating buttons and control points. P Created by Edraw - Comprehensive Diagramming Software
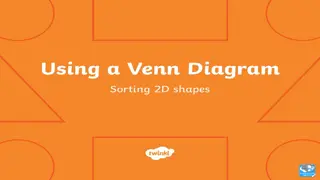
Venn Diagram Example - Animal Analysis Amphibians Jump and swim. We only live in air, we like flying. We can live in water and air. Can fly and live in tree house. Eat plant bugs. We only live in water, we like swimming. Live in water only. Sleep with eyes open. Frog Bird We all need water and bugs. Fish We all like water and swimming. We all need water and food. Created by Edraw - Comprehensive Diagramming Software
Venn Diagram Template Title Description Title Description Click to Add Text Click to Add Text Title Title Title Title Description Title Description Click to Add Text Created by Edraw - Powerful Professional Ven Diagram Software Created by Edraw - Powerful Professional Ven Diagram Software
Custom Venn Diagram - Sports Marketing Custom Venn Diagram - Sports Marketing Sports marketing agencies and advisors Consumer (Fans) Sports and entertainment Infrastructure, technology and logistics Marketing and consultancy service providers Sponsors(Brand owners) Created by Edraw - Comprehensive Diagramming Software
Venn Diagram Example - Math Worksheet Solve the Following Questions With Venn Diagrams Question 1 In a company of 28 people, 10 love cats, 14 love dogs, 7 love both cats and dogs, how many people love neither of the two? Answer: Score: Cats Dogs Question 3 Math In a class of 50 people, 26 love math, 30 love science, 22 love English. 11 loves both math and science, 6 love both science and English, 8 love both math and English. If 2 love all three subjects, how many people love none of the three? Answer: Score: Science English Created by Edraw - Comprehensive Diagramming Software
THANKS Created by Edraw - Comprehensive Diagramming Software