Math Quiz and Venn Diagrams
Venn diagrams for sorting numbers, probability calculations, the concept of angles in straight lines, and various math questions including factors, multiples, ratios, and conversion between 12-hour and 24-hour clocks are discussed in this educational content. The content also illustrates scenarios where Venn diagrams are used to represent overlapping sets of data.

Download Presentation

Please find below an Image/Link to download the presentation.
The content on the website is provided AS IS for your information and personal use only. It may not be sold, licensed, or shared on other websites without obtaining consent from the author. Download presentation by click this link. If you encounter any issues during the download, it is possible that the publisher has removed the file from their server.
E N D
Presentation Transcript
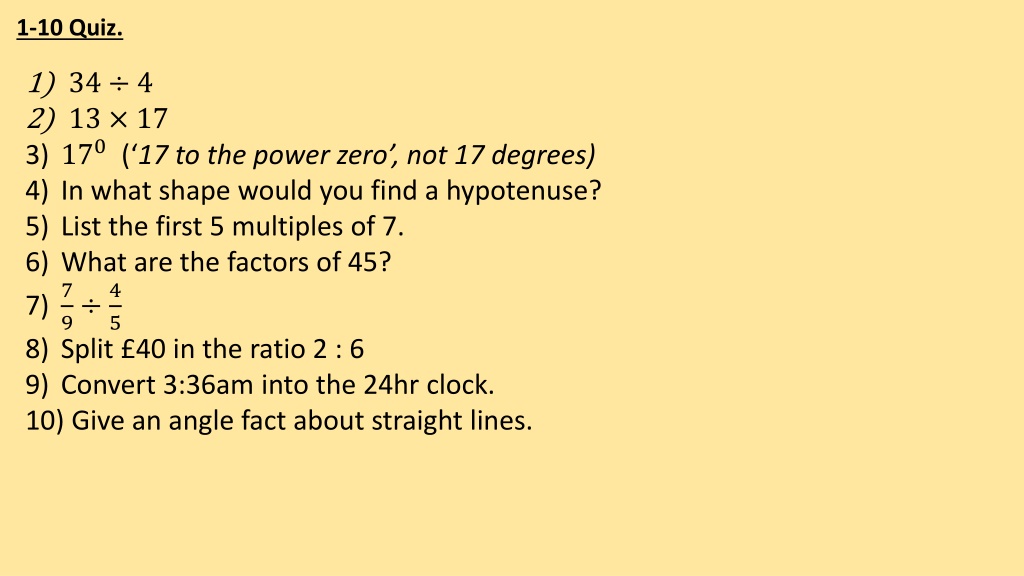
1-10 Quiz. 1) 34 4 2) 13 17 3) 170( 17 to the power zero , not 17 degrees) 4) In what shape would you find a hypotenuse? 5) List the first 5 multiples of 7. 6) What are the factors of 45? 7) 5 8) Split 40 in the ratio 2 : 6 9) Convert 3:36am into the 24hr clock. 10) Give an angle fact about straight lines. 7 9 4
1-10 Quiz. 1) 34 4 2) 13 17 3) 170( 17 to the power zero , not 17 degrees) 4) In what shape would you find a hypotenuse? 5) List the first 5 multiples of 7. 6) What are the factors of 45? 7) 5 8) Split 40 in the ratio 2 : 6 9) Convert 3:36am into the 24hr clock. 10) Give an angle fact about straight lines. 8.5 221 1 Right angled triangle 7, 14, 21, 28, 35 1, 4, 9, 45 35/36 10: 30 03:36 Add to 180 7 9 4
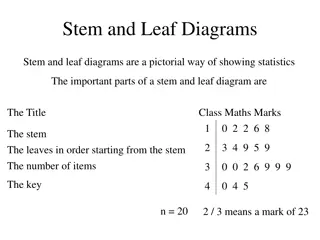
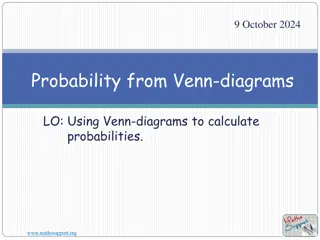
Title: Venn Diagrams, Lesson 2 Objectives To be able to fill in a Venn Diagram. To be able to use Venn Diagram notation. To be able to find probabilities from a Venn Diagram.
Starter Sort the numbers 1 10 into this Venn diagram. Even Square
Starter Sort the numbers 1 10 into this Venn diagram. 7 Even Square 2 1 8 4 6 9 10 3 5
Mirror Sun 60 people were asked which newspaper they d read in the past week. The Venn diagram on the right shows their responses. 18 5 8 3 1 6 A person is selected at random. Find the probability they: 2 Telegraph 17 a) Had read the Mirror but not the Sun b) Had read at least one of the newspapers c) Had read the Sun and the Telegraph but not the Mirror ??????????? =??? ????? ?? ? ? ???? ??? ???? ????? ?? ? ? ????????
When filling out a Venn Diagram always start from the centre and work out. e.g. 100 people were asked if they liked tea or coffee. 20 people said they like neither, 55 said they liked both, 67 said they liked Tea and 68 said they liked coffee. Draw a Venn diagram to represent this situation. C T 67 - 55 = 12 68 55 = 13 12 55 13 20
The same principle needs to happen when there are three circles: e.g. 114 people were asked if they liked apples, oranges or pears. - 42 said all 3 - 30 liked just A and O - 6 liked just O - 71 liked P - 57 liked A and P - 52 liked O and P - 92 liked A O A 5 30 6 42 15 10 4 2 P
120 people were asked what pet they had. 40 students were split according to two characteristics. 20 people had a rabbit 39 people had a cat 58 people had a dog 9 people had a cat and a rabbit 10 people had a dog and a rabbit 5 people had a dog and a cat 3 people had a dog, a cat and a rabbit 20 students had blonde hair 18 students had blue eyes 12 students had blue eyes and blonde hair a) Copy and complete the Venn diagram Blue Eyes Blonde Hair a) Complete the Venn diagram below Cat Dog b) A student is selected at random. What is the probability this student has exactly one of the characteristics? Rabbit b) A person is selected at random. What is the probability they have at least 2 pets?
A B A B AND rule This means A and B. A B A B OR rule This means A or B. A B ' A This means not A.
Sketch out these 6 Venn diagrams. They do not need to be particularly neat!
Todays Objectives Have you met them? Objectives To be able to fill in a Venn Diagram. To be able to use Venn Diagram notation. To be able to find probabilities from a Venn Diagram.
Suggested Videos For this lesson For next lesson Ordering Numbers: https://www.youtube.com/watch?v=gOmj58JdxL8 Ordering fractions decimals percentages Corbettmaths Percentages: Adding & Subtracting Fractions: https://www.youtube.com/watch?v=5juto2ze8Lg Math Antics - Adding and Subtracting Fractions Working with decimals: https://www.youtube.com/watch?v=kwh4SD1ToFc Math Antics - Decimal Arithmetic BIDMAS: https://www.youtube.com/watch?v=6K77Igo39vk GCSE Maths - BIDMAS - Aslam Tutoring


")
")
")
")
")
")
")
")
")
")
")
")