Exploring Venn Diagram Challenges in Mathematics

Delve into the world of Venn Diagram challenges in mathematics, where students engage in tasks that involve filling regions with numbers based on specified criteria. Discover the versatility and educational value of these activities while honing your analytical and problem-solving skills.

Download Presentation

Please find below an Image/Link to download the presentation.
The content on the website is provided AS IS for your information and personal use only. It may not be sold, licensed, or shared on other websites without obtaining consent from the author. Download presentation by click this link. If you encounter any issues during the download, it is possible that the publisher has removed the file from their server.
E N D
Presentation Transcript
Venn Diagrams 5. Averages and Range mr barton maths .com
About Venn Diagrams I began to see the huge potential for the use of Venn Diagrams as a rich task from my constant source of inspiration the amazing Median Maths Blog, by Don Steward. He created a lovely Straight Line Graphs Venn Diagrams task that you can access here Here is why I love Venn Diagram activities so much 1) Students can always make a start. If they can think of a number/expression/object or whatever it might be, it has to go in one of the regions on the diagram, so they are up and running 2) The more regions student find, the more challenging the task gets, which adds a nice element of differentiation 3) They are incredibly versatile, and can be used for almost all maths topics for all ages and abilities 4) They are very quick to create and require no special resources 5) Students can create their own Give them a go, and if you or your pupils cannot resist the urge to create your own Venn Diagram tasks, please let me know
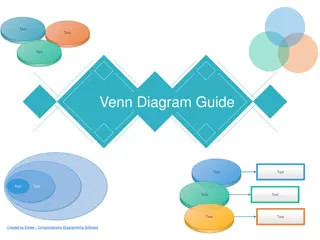
Instructions The diagram below shows how triple Venn Diagrams work Try to find an example of a number/expression/object to go into each of the 8 regions If you think it is impossible to find an example for one or more of the regions, try to explain why
Task 1 Mode = 4 Median = 5 c d b e h g a Think of a list of 5 numbers that could belong in each region f Range > Mean
Task 2 No mode Range < Mean c d b e h g a Think of a list of 5 numbers that could belong in each region f Median = Mean
Task 3 Mean > Median Median > Range c d b e h g a Think of a list of 5 numbers that could belong in each region f Mode = Mean
Venn Diagrams Challenges Which was the easiest region to complete, and which was the hardest? Which region has the most possible examples, and which has the fewest? If you think it is impossible to find an example for a particular region, convince me why Describe your strategy for filling in the regions Create your own Venn Diagram on this topic where it is possible to fill in all the regions Create your own Venn Diagram on this topic when it is impossible to fill in just 1 of the regions. How about one where it is impossible to fill in 2, 3, 4, etc regions? Can you create a quadruple Venn Diagram for this topic?
Venn Diagrams Challenges (adapted) Which was the easiest region to complete, and which was the hardest? Describe your strategy for filling in the regions If you think it is impossible to fill in a region, identify and change one of the categories to make it possible
Venn Diagrams Ultimate Challenges! 1. Create your own Venn Diagram on this topic when it is impossible to fill in just 1 of the regions. How about one where it is impossible to fill in 2, 3, 4, etc regions? 2. Can you create a quadruple Venn Diagram for this topic?


")

 – Task 1")
 – Task 2")
 – Task 3")
 – Task 3")
 – Task 3")
 – Task 3")