Exploring Stem and Leaf Diagrams for Statistical Analysis
Stem and leaf diagrams provide a visual way to represent statistical data effectively. This article showcases examples of stem and leaf diagrams for various datasets, including math marks, pulse rates, pocket money, speeds of cars, distances in meters, and comparison between two classes. The diagrams help in analyzing the distribution and trends within the data sets.

Download Presentation

Please find below an Image/Link to download the presentation.
The content on the website is provided AS IS for your information and personal use only. It may not be sold, licensed, or shared on other websites without obtaining consent from the author. Download presentation by click this link. If you encounter any issues during the download, it is possible that the publisher has removed the file from their server.
E N D
Presentation Transcript
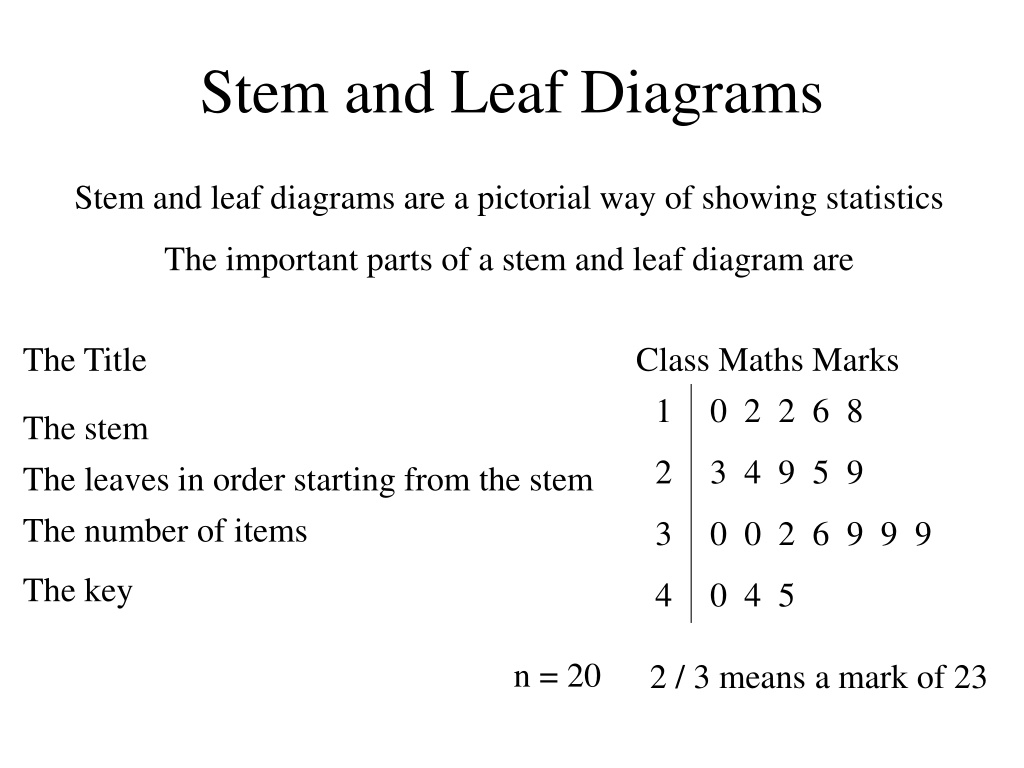
Stem and Leaf Diagrams Stem and leaf diagrams are a pictorial way of showing statistics The important parts of a stem and leaf diagram are The Title Class Maths Marks 1 0 2 2 6 8 The stem The leaves in order starting from the stem The number of items 2 3 4 9 5 9 3 0 0 2 6 9 9 9 The key 4 0 4 5 n = 20 2 / 3 means a mark of 23
A group of students measured their pulse rates in beats per minute. The results were. 66 69 62 58 74 56 67 72 61 62 59 60 72 58 63 Draw a Stem and Leaf diagram to show this We need a title Pulse rates (beats per minute) 5 8 6 9 8 6 8 8 9 We need the stems 6 6 9 2 7 1 2 0 3 0 1 2 2 3 6 7 9 We need the Leaves 7 4 2 2 2 2 4 We need to reorder the leaves We need to write in n n = 15 6 / 2 means 62 beats per minute We need the key
A group of students were asked how much pocket money they get. The results were. 6.60 6.90 6.20 5.80 7.40 5.60 6.70 7.20 6.10 6.20 5.90 6.00 7.20 5.80 6.30 Draw a Stem and Leaf diagram to show this Pocket money 5 6 8 8 9 Note this gives us the same diagram as the previous example. This shows the importance of the title and key. 6 0 1 2 2 3 6 7 9 7 2 2 4 n = 15 6 / 2 means 6.20
Draw Stem and Leaf Diagrams for the following sets of data Speed in mph 3 2 4 5 6 7 8 9 The speed of cars, in mph, passing police speed check 4 2 2 6 8 8 35 46 32 48 53 58 60 39 36 48 34 51 42 37 53 42 51 38 1 1 3 3 8 6 0 n = 18 4/3 means 43mph Distance in metres John took a note of how far, in metres, he was able to hit a golf ball 10 1 5 8 11 1 2 5 8 12 0 1 1 2 7 7 9 9 108 115 132 121 101 122 138 127 105 112 118 127 129 120 139 136 131 121 111 129 137 13 1 2 6 7 8 9 n = 21 12/3 means 123m
Stem and Leaf diagrams can be used to compare 2 sets of data. To do this we draw a back to back stem and leaf diagram. Maths marks for class 1A Maths marks for class 1B 8 0 6 8 9 8 5 3 1 1 2 2 2 5 5 8 9 4 4 5 2 0 2 0 0 1 1 6 7 6 4 3 1 1 0 3 3 7 7 7 3 3 3/2 means a mark of 32 4 1 n = 19 n = 20 How many students in 1A had a mark of 31? 2 How many students in 1B had a mark of 12? 3 1A Which class appears to be best at Maths?
Use the Back to Back Stem and Leaf Diagram to answer the questions Books borrowed from the library This week 2 0 1 4 1 3 1 5 6 7 4 4 3 4 0 4 5 1 0 5 2 4 1 6 3 n = 10 2/0 represents 20 books Last week n = 10 65 ? 129 ? This week ? 387 ? How many books were borrowed at level 3 this week How many books were borrowed at level 4 last week Which week was best for the library How many books were borrowed last week altogether