Probability Calculations with Venn Diagrams in School and City Settings
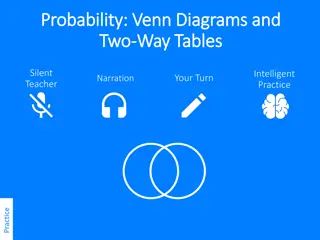
Explore probability calculations using Venn diagrams in scenarios involving student subjects (Geography and Biology) in a secondary school and newspaper readership in a city. Understand how to calculate probabilities related to studying specific subjects, studying none of the subjects, and reading specific newspapers based on survey data. Visual representations in Venn diagrams enhance comprehension of the relationships between different sets of data.

Download Presentation

Please find below an Image/Link to download the presentation.
The content on the website is provided AS IS for your information and personal use only. It may not be sold, licensed, or shared on other websites without obtaining consent from the author. Download presentation by click this link. If you encounter any issues during the download, it is possible that the publisher has removed the file from their server.
E N D
Presentation Transcript
9 October 2024 Probability from Venn-diagrams LO: Using Venn-diagrams to calculate probabilities. www.mathssupport.org www.mathssupport.org
In a Secondary School of 90 students, 35 study Geography, 45 study Biology and 10 study both Geography and Biology. Show this information in a Venn Diagram. B G 25 10 35 20 If a student is chosen at random, find the probability that he or she study Geography and Biology. P(study both subjects) = 10 90 www.mathssupport.org www.mathssupport.org
In a Secondary School of 90 students, 35 study Geography, 45 study Biology and 10 study both Geography and Biology. Show this information in a Venn Diagram. B G 25 10 35 20 If a student is chosen at random, find the probability that he or she study exactly one of the subjects. P(study exactly one of the subjects) = 60 90 www.mathssupport.org www.mathssupport.org
In a Secondary School of 90 students, 35 study Geography, 45 study Biology and 10 study both Geography and Biology. Show this information in a Venn Diagram. B G 25 10 35 20 If a student is chosen at random, find the probability that he or she study none of the subjects. 20 90 P(study none of the subjects) = www.mathssupport.org www.mathssupport.org
A city has three newspapers, A, B and C. Of the adult population 300 were surveyed, these are the results: 3 read none of these newspapers, 108 read A, 120 read B, 156 read C, 24 read A and B, 33 read B and C, 39 read A and C and 9 read all three papers. Draw a Venn-diagram to represent this information. A B 15 72 54 9 24 30 93 3 C One of the people surveyed is chosen at random. Find the probability that he or she reads Newspaper A only 54 300 P(A) = www.mathssupport.org www.mathssupport.org
A city has three newspapers, A, B and C. Of the adult population 300 were surveyed, these are the results: 3 read none of these newspapers, 108 read A, 120 read B, 156 read C, 24 read A and B, 33 read B and C, 39 read A and C and 9 read all three papers. Draw a Venn-diagram to represent this information. A B 15 72 54 9 24 30 93 3 C One of the people surveyed is chosen at random. Find the probability that he or she reads Newspaper B or newspaper C 243 30+15+9+93+72+24 300 P(B or C) = = 300 www.mathssupport.org www.mathssupport.org
A city has three newspapers, A, B and C. Of the adult population 300 were surveyed, these are the results: 3 read none of these newspapers, 108 read A, 120 read B, 156 read C, 24 read A and B, 33 read B and C, 39 read A and C and 9 read all three papers. Draw a Venn-diagram to represent this information. A B 15 72 54 9 24 30 93 3 C One of the people surveyed is chosen at random. Find the probability that he or she reads Newspaper A or B but not C 141 54+15+72 300 = P(A or B but not C) = 300 www.mathssupport.org www.mathssupport.org
A city has three newspapers, A, B and C. Of the adult population 300 were surveyed, these are the results: 3 read none of these newspapers, 108 read A, 120 read B, 156 read C, 24 read A and B, 33 read B and C, 39 read A and C and 9 read all three papers. Draw a Venn-diagram to represent this information. A B 15 72 54 9 24 30 93 3 C One of the people surveyed is chosen at random. Find the probability that he or she reads exactly two of the three newspapers 69 15+30+24 300 = P(exactly two) = 300 www.mathssupport.org www.mathssupport.org
Thank you for using resources from A close up of a cage Description automatically generated For more resources visit our website https://www.mathssupport.org If you have a special request, drop us an email info@mathssupport.org www.mathssupport.org www.mathssupport.org