Comprehensive Guide to Fishbone Diagrams for Effective Problem-solving
The fishbone diagram, also known as the cause and effect diagram or Ishikawa diagram, is a powerful tool used to identify all possible causes of a problem in a business process. This guide covers the definition, history, benefits, and tips for creating fishbone diagrams, along with information on fishbone diagram software for seamless diagram-making. Use this guide to enhance your cause and effect analysis and improve problem-solving processes.

Download Presentation

Please find below an Image/Link to download the presentation.
The content on the website is provided AS IS for your information and personal use only. It may not be sold, licensed, or shared on other websites without obtaining consent from the author. Download presentation by click this link. If you encounter any issues during the download, it is possible that the publisher has removed the file from their server.
E N D
Presentation Transcript
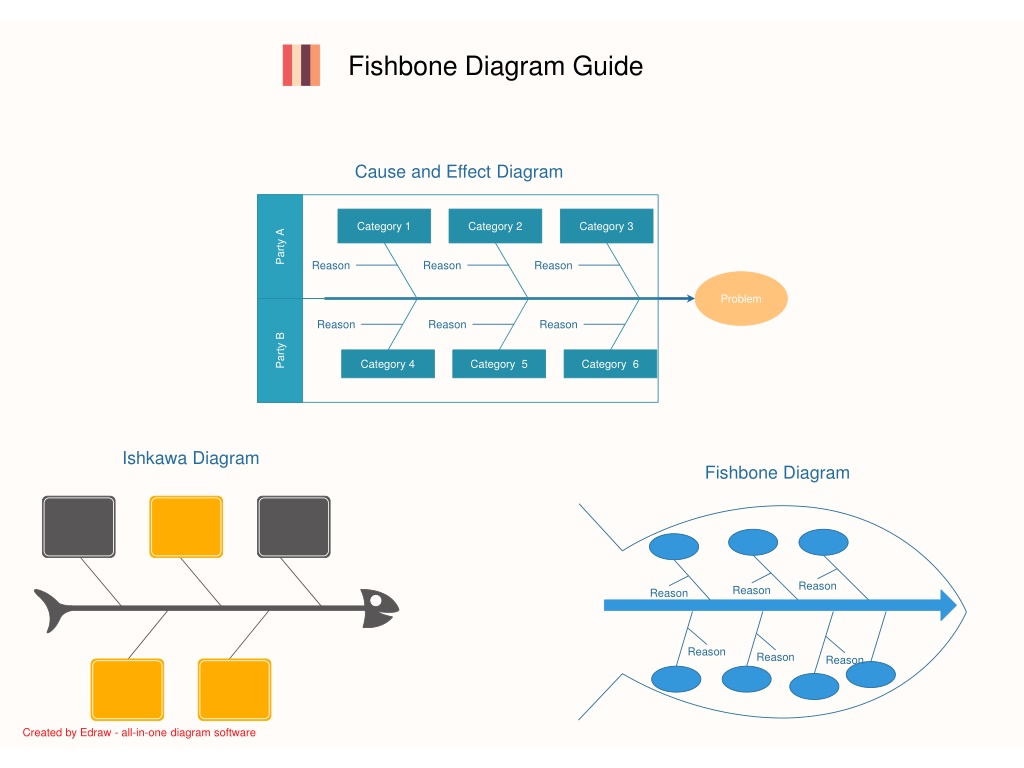
Fishbone Diagram Guide Cause and Effect Diagram Category 1 Category 2 Category 3 Party A Reason Reason Reason Problem Reason Reason Reason Party B Category 4 Category 5 Category 6 Ishkawa Diagram Fishbone Diagram Reason Reason Reason Reason Reason Reason Created by Edraw - all-in-one diagram software Created by Edraw - all-in-one diagram software
Contents Fishbone Diagram Software 04 Definition of Fishbone Diagram 01 Tips to Draw Fishbone Diagram 05 02 History of Fishbone Diagram Useful Methods for Cause and Effect analysis 06 03 Benefits of Fishbone Diagram Fishbone Diagram Examples 07 Created by Edraw - all-in-one diagram software
Definition of Fishbone Diagram The fishbone diagram, or the cause and effect diagram, is a simple graphic display that shows all the possible causes of a problem in a business process. It is also called the Ishakawa diagram. Created by Edraw - all-in-one diagram software
History of Fishbone Diagram 1943 1960 1990 The fishbone, or cause & effect diagram, was first used by Dr. Kaoru Ishikawa, a pioneer of quality management, of the University of Tokyo in 1943. The technique was then published in Kaoru Ishikawa's 1990 book, "Introduction to Quality Control." Fishbone diagram was devised by professor Kaoru Ishikawa in the 1960s. Created by Edraw - all-in-one diagram software
Benefits of Fishbone Diagram Display Relationships Logically and Clearly Show All Causes Simultaneously in 1 Diagram Your Text Your Text Facilitate Brainstorming Help Maintain Team Focus Created by Edraw - all-in-one diagram software
Fishbone Diagram Software Various templates and examples User Interface Drag and drop function More than 8000 vector symbols Automatic connection of shapes Seamless integration with MS Office Edraw fishbone diagram maker - make creative fishbone diagram instantly. In-depth tutorials Edraw fishbone diagram maker - make creative fishbone diagram instantly. Created by Edraw - all-in-one diagram software
Tips to Create Fishbone Diagram If you choose to draw on hand, consider drawing your fishbone diagram on a flip chart or large dry erase board. Same causes can be written in several places if they relate to several categories. Be clear about the major categories of causes of the problem (written as branches from the main arrow). Make full use of the fishbone diagram tool to help the team focused on the causes of the problem, rather than the symptoms. Brainstorm all the possible causes of the problem. Organize a team to carry out the undertaking rather than rely on your own. Created by Edraw - all-in-one diagram software
Useful Methods for Cause and Effect analysis The first W is What. The second W is Where. The third W is When. The forth W is Who. Then it is about How. The last W is Why. 5W1H 1. Manpower 2. Machinery 3. Materials 4. Method 5. Mother-nature 6. Measurement 6M 1. Physical Evidence 2. Personnel 3. Place 4. Product (Service) 5. Price 6. Promotion 7. Process 8. Productivity & quality 8P Created by Edraw - all-in-one diagram software
5W1H Method for Cause-effect Analysis 5W1H Method for Cause-effect Analysis Is there anything else to do? What should be done? What What should be improved? What is the purpose of improvement. Why operate in that location? Which is the best location to achieve highest efficiency? Is the worker s orientation or method correct when changing the workplace? Where Why perform at that time? Will it be better to execute at other time? When Change the time, period or sequence of the operation. Manpower, collaboration or task assignment. Check and discuss this issue again. Why designate someone as the person in charge? Is there a better candidate? Who Change the method or procedure so that less manpower is needed. Apply the method that requires less degree of proficiency and expense. Why to do it? Is there better method to replace the current one? How Doubt everything again. Think over and discuss the above 5 questions by asking more why and then find out the best solution for improvement. Why follow the present way. Is there any necessary supplement or change? Why Created by Edraw - all-in-one diagram software
Measurements Materials Manpower Specimen not sufficient Not enough ice Can't procure specimen Analyzer out of calibration Plastic bag not up to standard Patients not in room Lab Results Delay Order slip delays Room too hot No centrifuge Message delay Courtesy visit Room too cold Lack analyzer Poor identification Mother nature Methods Machines Note: The 6M method is applied in this analysis, categorizing the reasons into Manpower, Materials, Measurements, Mother nature, Methods and Machines. Created by Edraw - all-in-one diagram software
Service Problem - Ishikawa (Fishbone) Diagram Template Product (Service) Physical Evidence Personnel Place Sub-cause Sub-cause Sub-cause Sub-cause Sub-cause Sub-cause Sub-cause Sub-cause Sub-cause Sub-cause Sub-cause Sub-cause Service Problem Sub-cause Sub-cause Sub-cause Sub-cause Sub-cause Sub-cause Sub-cause Sub-cause Sub-cause Sub-cause Sub-cause Sub-cause Productivity & quality Process Promotion Price The 8P method can be used to analyze problems in service industry, categorizing the causes into Physical Evidence, Personnel, Place, Product (Service), Price, Promotion, Process, and Productivity & quality. Created by Edraw - all-in-one diagram software
Relationship with Co-workers Management Workload Environment Welfare Salary Different concepts Demanding Location No incentive Employer Control low cost Low welfare High pressure Harsh Lack of communication Climate management Low salary No welfare Office environment Too much work No Misunderstanding promotion Resign Not confident Transportation Poor constitution Change profession Conflict between work and life Find a job with higher pay. Poor adaption ability Illness Employee Not qualified Stressful Change of address Further studies Plan Change Health Residence Self-confidence XXX: Important reasons Created by Edraw - all-in-one diagram software


 Diagram Template")