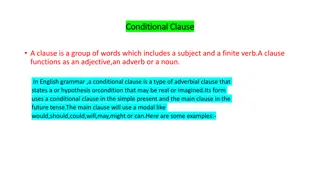
Understanding Conditional Probability and Venn's Diagram

Delve into the concepts of conditional probability and Venn's diagram, exploring how they help analyze dependent events and logical relations between sets. Learn about calculating probabilities in scenarios like different colored pencils in a box and coin toss outcomes, illustrated with examples and diagrams.

Download Presentation

Please find below an Image/Link to download the presentation.
The content on the website is provided AS IS for your information and personal use only. It may not be sold, licensed, or shared on other websites without obtaining consent from the author. Download presentation by click this link. If you encounter any issues during the download, it is possible that the publisher has removed the file from their server.
E N D
Presentation Transcript
Al-Mustaqbal University College Department of Computer Engineering Techniques Information Theory and coding Fourth stage By: MSC. Ridhab Sami
Lecture 3 Conditional Probability and Venn's Diagram
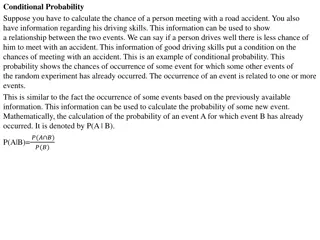
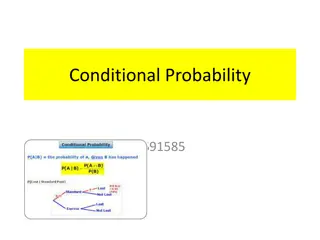
Conditional Probability: It is happened when there are dependent events. We have to use the symbol "|" to mean "given": P(B|A) means "Event B given Event A has occurred". P(B|A) is also called the "Conditional Probability" of B given A has occurred . And we write it as: ?????? ?? ???????? ?? ? ??? ? ?????? ?? ???????? ?? ? ?(? | ?) = Or ?(? ?) ?(?) ?(? | ?) = Where P(B) > 0
Example: A box contains 5 green pencils and 7 yellow pencils. Two pencils are chosenat random from the box without replacement. What is the probability they are different colors? Solution: Using a tree diagram: 7+5 = 12 6 +5 =11 7+5 = 12 7 +4 =11
Example: Find the conditional prob. For Toss a fair coin 3 times :1- What is theprobability of 3 heads? 2- What is the probability of head? Solution: S= {HHH,HHT,HTH,HTT,THH,THT,TTH,TTT} A={HHH} B= {HHH,HHT,HTH,HTT} The conditional probability of A given B is written P(A|B) and is defined ?(? ?) ?(?) ?(? | ?) = We have P(A)=1/8 P(B)=4/8 P(A B)= 1/8 P(A|B) =1/8 1 4 4/8=
Venn's Diagram A Venn diagram is a diagram that shows all possible logical relations between a finite collections of different sets. These diagrams depict elements as points in the plane, and sets as regions inside closed curves. A Venn diagram consists of multiple overlapping closed curves, usually circles, each representing a set. The points inside a curve labelled S represent elements of the set S, while points outside the boundary represent elements not in the set S. Fig. 5 shows the set ? = {1,2,3},? = {4,5} ???? = {1,2,3,4,5,6}.