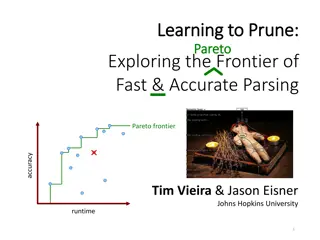
MATLAB Workshop: Graphs, Runtime Analysis, and Plotting Techniques
MATLAB Workshop Part 3 delves into the creation of 2D and 3D plots, along with advanced plotting commands, runtime analysis using tic and toc functions, and the utilization of the MATLAB profiler. The content demonstrates techniques for plotting multiple curves, creating subplots, and visualizing data effectively using histograms, bar charts, and other plotting functions. Through detailed examples and explanations, participants can enhance their visualization and analysis skills in MATLAB.
- - MATLAB Workshop
- Graphs - Runtime Analysis
- Plotting - 2D Plots
- 3D Plots - MATLAB Profiler
- Data Visualization

Uploaded on Sep 25, 2024 | 0 Views
Download Presentation

Please find below an Image/Link to download the presentation.
The content on the website is provided AS IS for your information and personal use only. It may not be sold, licensed, or shared on other websites without obtaining consent from the author. Download presentation by click this link. If you encounter any issues during the download, it is possible that the publisher has removed the file from their server.
E N D
Presentation Transcript
MATLAB WORKSHOP Part 3: Graphs and Runtime
Content 2D plots (advanced) 3D plots Runtime analysis tic toc MATLAB profiler
2D plots Plot commands: figure(1); theta= linspace(0,pi*5,100); phi= pi : pi/10 : 5.5*pi; plot(theta, sin(theta), 'r-o') hold on; plot(phi, cos (phi), 'k-o') 1 0.8 0.6 0.4 0.2 0 -0.2 -0.4 -0.6 -0.8 -1 0 2 4 6 8 10 12 14 16 18 Another method is to give Y-value matrix corresponding to several different curves. Each row vector in the matrix will be shown as a separate curve. For example: 1 0.8 figure(2); X= theta; Y= [cos(X) ; 0.5*sin(X)]; plot(X, Y) 0.6 0.4 0.2 0 -0.2 -0.4 -0.6 -0.8 -1 0 2 4 6 8 10 12 14 16
2D plots More than one plot in the window Sometimes we want to divide our window to a few panels. We do this using the subplot command: subplot(num_rows , num_columns , current_index) The current_index fits the numbering convetion starting from the left up corner, running over the row, and goes to the next line For example, if num_rows=3, num_columns=4 1 2 3 4 current_index= 5 6 7 8 9 10 11 12
2D plots Subplot example: Sine function 1 figure(3); subplot(2,1,1) plot(theta, sin(theta), 'r-o') title('Sine function') subplot(2,1,2) plot(phi, cos(phi), 'k-o') title('Cosine function') 0.5 0 -0.5 -1 0 2 4 6 8 10 12 14 16 Cosine function 1 0.5 0 or -0.5 -1 a= subplot(2,1,1); b= subplot(2,1,2); plot(a, theta, sin(theta), 'r-o'); plot(b, phi, cos(phi), 'k-o'); 2 4 6 8 10 12 14 16 18
2D plots Other 2D plots: Function Action of the function hist Histogram of vector values bar Bar chart stem Plot of discrete points plotyy Two plots with different y axis in the same window
2D plots Histogram 4 x 10 3.5 3 x=randn(1,100000); figure; hist(x) 2.5 2 1.5 1 (randn normal distribution with ? = 0,? = 1) 0.5 0 -5 -4 -3 -2 -1 0 1 2 3 4 5 You can set the resolution of the histogram (widths of intervals) 4500 4000 3500 3000 hist(x, -4:0.1:4); 2500 2000 1500 1000 500 0 -5 -4 -3 -2 -1 0 1 2 3 4 5
2D plots Bar x= 1900:10:2010; y= [75 91 105 123.5 131 150 179 203 226 244 281 307]; bar(x,y) xlabel('year') ylabel('Number of citizens in millions') title ('US population') US population 350 300 250 Number of citizens in millions 200 150 100 50 0 1900 1910 1920 1930 1940 1950 1960 1970 1980 1990 2000 2010 year
2D plots stem sinc function 1 0.8 0.6 x= linspace(-10,10,200); y= sinc(x); stem(x,y) title('sinc function') 0.4 0.2 0 -0.2 -0.4 -10 -8 -6 -4 -2 0 2 4 6 8 10
2D plots plotyy x= 0:0.01:20; y1= 200*exp(-0.05*x).*sin(x); y2= 0.8*exp(-0.5*x).*sin(10*x) figure; plotyy(x, y1, x, y2) legend('function 1', 'function 2') 200 0.8 function 1 function 2 150 0.6 100 0.4 50 0.2 0 0 -50 -0.2 -100 -0.4 -150 -0.6 -200 -0.8 0 0 2 2 4 4 6 6 8 8 10 10 12 12 14 14 16 16 18 18 20 20
2D plots Additional functions Add grid lines grid on; Limit range of both X and Y axes axis([x_min , x_max , y_min , y_max]) Add text anywhere on the plot text(x_val , y_val , 'some text') You can change font size by Fontsize [y_max, ind] = max(y); text(x(ind) , y_max, 'Max' , 'Fontsize' , 15) All these can be added also using the menus in the figure window.
2D plots Additional functions Change the axis scale to a logarithmic scale: you can use semilogx or semilogy or loglog functions instead of plot. Any specific color can be set by using the Color field and entering a vector of RGB color (3 values in the range[0,1]); 0.6 0.5 0.4 x=1:0.1:20; plot(x, besselj(1,x), Color , 0.5*[0 1 0]) hold on plot(x, besselj(2,x), Color , [128 0 256]/256) 0.3 0.2 0.1 0 -0.1 -0.2 -0.3 -0.4 0 2 4 6 8 10 12 14 16 18 20
3D plots Different types of 3D plots Function Action of the function plot3 Curve (line) in 3D mesh 3D surface, the surface will be semi-transparent surf 3D surface, the surface will be opaque contour Contour plot (z axis is the color) imagesc Normalized color map
3D plots plot3: Plotting the 3D points created using the vectors (x(t),y(t),z(t)) and connecting them with a curve t = linspace(0 , 10*pi , 100); x = cos(t); y = sin(t); z = t / (2*pi); figure(99); plot3(x , y , z); xlabel('x'); ylabel('y'); zlabel('z'); title('Spiral'); grid on Spiral 5 4 3 z 2 1 0 1 0.5 1 0.5 0 0 -0.5 -0.5 -1 -1 y x
3D plots Draw grid Use meshgrid function to draw mesh X(i,j)=x(j) Y(i,j)=y(i) [X , Y]= meshgrid(x , y) ; 1 2 3 4 1 2 3 4 X= 1 x= 1 2 3 4 0.8 1 2 3 4 0.6 0.4 10 10 10 10 0.2 10 20 30 y= 0 -0.2 20 20 20 20 Y= -0.4 -0.6 30 30 30 30 -0.8 4 -1 30 3 2 20 1 10
3D plots mesh, surf, contour Let s draw 2D Gaussian distribution z(x,y) x= -10:0.5:10; y= -10:0.5:10; [X , Y]= meshgrid(x , y) ; Z= 1/sqrt(2*pi)*exp(-0.5*(X.^2 + Y.^2)) ; figure; mesh(X , Y , Z) ; title('mesh' , 'FontSize' , 15) ; figure; surf(X , Y , Z) ; title('surf' , 'FontSize' , 15) ; figure; contour(X , Y , Z) ; title('contour' , 'FontSize' , 15) ; colorbar % presenting a color bar next to the graph
3D plots mesh, surf, contour mesh surf contour 10 0.35 0.4 0.4 8 0.3 0.3 6 0.3 4 0.25 0.2 2 0.2 0 0.2 0.1 0.1 -2 0.15 -4 0 0 -6 10 10 0.1 5 10 5 10 -8 5 5 0 0 -10 0.05 0 0 -10 -5 0 5 10 -5 -5 -5 -5 -10 -10 -10 -10
3D plots imagesc Receives vectors of x and y values and matrix Z and plots Z(x,y) as a color map imagesc -10 30 x= -10:0.01:10; y= -10:0.01:10; [X , Y]= meshgrid(x , y) ; Z= X .* Y .* (X.^2 - Y.^2-10) ./ (Y.^2 +X.^2+1); figure; imagesc(x , y , Z) ; title('imagesc' , 'FontSize' , 15) ; colorbar -8 -6 20 -4 10 -2 0 0 2 -10 4 6 -20 8 -30 10 -10 -5 0 5 10
Runtime analysis tic toc We can measure code runtime by writing a tic command before the code and toc at the end of the code. MATLAB will display the calculation time. tic SOME CODE toc Example Comparing the runtime of summing two very long vectors: 1 By using for loop 2 By using vector connection
Runtime analysis Solution clear all x= rand(1,1e7); y= rand(1,1e7); tic % start time measuring z = x + y; toc % end time measuring tic % start time measuring z= zeros(size(x)); for ii=1:length(x) z(ii)= x(ii)+y(ii); end toc % end time measuring Conclusion: vector/matrix calculation is more efficient than for and while loops.
Runtime analysis profiler We can analyze runtime of a function/code by writing the profile on command before calling a function and profile off at the end of the function. profile on SOME FUNCTION profile off profile viewer
Tips Information about variables and functions The command whos gives information about variable: size and type whos x % Name Size Bytes Class Attributes % x 1x10000000 80000000 double The command which gives the address on the comuter, where a script is stored: which my_script % C:\temp\my_script.m isempty check whether an array is empty (1 means empty) Keyboard commands F5 runs program F9 runs several lines of code that are currently selected.