
Understanding Expander Families and Ramanujan Graphs
An introduction to expander families and Ramanujan graphs by Tony Shaheen from CSU Los Angeles. The discussion covers the concept of regular graphs, motivation behind expander families, communication networks, and the goal of creating an infinite sequence of d-regular graphs optimized for communicat
0 views • 54 slides

Exploring Product and Knowledge Graphs for Enhanced Information Retrieval
Dive into the world of product and knowledge graphs, uncovering the journey to a rich product graph, examples of knowledge graphs for songs, and the mission to provide comprehensive information on products and related knowledge. Discover use cases ranging from information provision to enhancing sear
3 views • 76 slides

Line Segment Intersection
Geometric intersections play a crucial role in computational geometry for tasks such as solid modeling, collision detection in robotics, and overlaying subdivisions in geographic information systems. The problem of line segment intersection involves finding all intersection points between a set of c
0 views • 17 slides
Overview of .NET Framework and CLR Architecture at Amity School of Engineering
Explore the .NET Framework and Common Language Runtime (CLR) architecture at Amity School of Engineering & Technology, covering topics such as .NET components, technical architecture, common language runtime, CLR execution model, and more. Discover the support for multiple languages and the .NET lan
0 views • 28 slides

Exploring Various Types of Graphs in Statistics Education
Delve into the world of data visualization with slow reveal graphs, column graphs, pictographs, dot plots, divided bar graphs, sector graphs, line graphs, and stem-and-leaf plots. Engage in observations and wonderings to enhance statistical comprehension and analytical skills.
1 views • 8 slides

Dynamic Memory Allocation in Computer Systems: An Overview
Dynamic memory allocation in computer systems involves the acquisition of virtual memory at runtime for data structures whose size is only known at runtime. This process is managed by dynamic memory allocators, such as malloc, to handle memory invisible to user code, application kernels, and virtual
0 views • 70 slides

Exploring Graphs: An Introduction to Data Visualization
This chapter delves into various types of graphs used in data representation, such as bar graphs, pie graphs, histograms, line graphs, and linear graphs. It explains the purpose and structure of each graph type, along with practical examples. Additionally, it covers the Cartesian system for locating
0 views • 15 slides

Understanding Bar Graphs, Double Bar Graphs, and Histograms
Bar graphs are useful for displaying and comparing data, while double bar graphs help compare two related datasets. Histograms show the distribution of data. Learn how to interpret and create these visual representations effectively with examples provided.
0 views • 20 slides

Primal-Dual Algorithms for Node-Weighted Network Design in Planar Graphs
This research explores primal-dual algorithms for node-weighted network design in planar graphs, focusing on feedback vertex set problems, flavors and toppings of FVS, FVS in general graphs, and FVS in planar graphs. The study delves into NP-hard problems, approximation algorithms, and previous rela
0 views • 17 slides

Understanding Exceptions in Computer Science
Errors in programming, such as syntax, semantic, runtime, and logical errors, can disrupt the execution of a program. Syntax errors relate to grammatical violations, semantic errors occur when statements lack meaning, and runtime errors happen during program execution due to illegal operations. By i
1 views • 35 slides

Understanding Graphs of Straight Lines and Equations
Learn how to graph equations and find equations from graphs of straight lines. Explore tables of values, plotting points on a coordinate plane, drawing lines through points, and identifying relationships between graphs and algebraic expressions. Discover the gradient-intercept form of a straight lin
0 views • 14 slides

Understanding Speed vs. Time Graphs: Analyzing Acceleration and Motion
Explore the concept of speed vs. time graphs and learn how to recognize acceleration, interpret speed, analyze motion, and calculate acceleration from the slope of the graph. Discover the characteristics of graphs showing constant acceleration, varying acceleration, and deceleration. Engage in drawi
0 views • 19 slides
Semantic Analysis of Clinical Narratives Using Complex Knowledge Graphs
Need for improved semantic analysis of clinical narratives for information retrieval and decision support is addressed through the use of complex knowledge graphs. These graphs capture axiomatic descriptions of generalizable truths about entities in the medical domain, providing a language-independe
0 views • 8 slides

Understanding Debugging in Programming
Debugging is a crucial aspect of programming to identify and fix errors that can cause program failures, hangs, or unexpected results. There are different types of errors such as compile errors, runtime errors, and logic errors, each requiring a different approach to resolve. Learning about the mode
0 views • 20 slides
Runtime Checking of Expressive Heap Assertions
Motivated by the unreliability of large software systems due to concurrency bugs and limitations of static analysis, the goal is to enable runtime analysis of deep semantic properties with low overhead. This involves checking expressive heap assertions at runtime with minimal impact on performance,
0 views • 15 slides
Understanding .NET Framework Architecture and Common Language Runtime
This content delves into the intricacies of .NET architecture, highlighting its structure, common language runtime, and key components such as Common Type System (CTS) and Common Language System (CLS). It explains how .NET supports multiple languages, facilitates cross-language interoperability, and
0 views • 13 slides

Representation of Abstract Groups through Graphs
Explore the representation of abstract groups as automorphism groups of graphs, touching on topics such as the existence of graphs whose automorphism groups are isomorphic to given abstract groups, the cardinality of connected graphs satisfying specific properties, and questions regarding the cardin
0 views • 16 slides
Understanding Low Threshold Rank Graphs and Their Structural Properties
Explore the intriguing world of low threshold rank graphs and their structural properties, including spectral graph theory, Cheeger's inequality, and generalizations to higher eigenvalues. Learn about the concept of threshold rank, partitioning of graphs, diameter limits, and eigenvectors approximat
0 views • 22 slides

Exploring Types of Graphs for Data Representation
Different types of graphs, such as line graphs, scatter plots, histograms, box plots, bar graphs, and pie charts, offer diverse ways to represent data effectively. Understanding when to use each type based on the data being collected is essential for insightful analysis. Scatter plots are ideal for
2 views • 37 slides

Exploring Relationships Through Graphs
Learn how to analyze and relate two quantities using graphs, analyze data presented in tables and graphs, and sketch graphs representing various scenarios such as the movement of a model rocket or a playground swing. The visuals provided will help you understand how to interpret and draw graphs in d
2 views • 7 slides
Implementing Heaps: Node Operations and Runtime Analysis
Understanding the implementation of heaps involves knowing various node operations like finding the minimum node, last node, next open space, children, and parent. The runtime analysis of heap operations such as peekMin, removeMin, and insert are crucial for optimizing performance. This recap covers
0 views • 9 slides
Dynamic Memory Management Overview
Understanding dynamic memory management is crucial in programming to efficiently allocate and deallocate memory during runtime. The memory is divided into the stack and the heap, each serving specific purposes in storing local and dynamic data. Dynamic memory allocators organize the heap for efficie
0 views • 31 slides

Understanding Correlation in Scatter Graphs
In this content, various graphs are used to demonstrate the concept of correlation in scatter graphs. It discusses positive, negative, and no correlation, showcasing how one variable affects the other. Examples and explanations are provided to help understand the relationships between different sets
0 views • 17 slides

Symmetric Chromatic Function for Voltage Graphs
Exploring the concept of a Symmetric Chromatic Function (SCF) for voltage graphs involves proper coloring conditions for edges and vertices, edge polarization functions, and decomposing voltage graphs into disconnected and connected squiggly graphs. The SCF allows for determining the number of ways
0 views • 7 slides

Uniquely Bipancyclic Graphs by Zach Walsh
Research conducted at the University of West Georgia focused on uniquely bipancyclic graphs, defined as bipartite graphs with exactly one cycle of specific lengths determined by the order. Uniquely bipancyclic graphs have special properties, including having a Hamiltonian cycle and a specific order
0 views • 18 slides
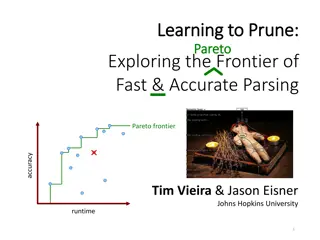
Exploring Fast & Accurate Parsing With Learning to Prune
In this informative content, the concept of learning to prune is discussed in the context of exploring the frontier of fast and accurate parsing. It delves into the optimization tradeoff between runtime and accuracy in end-to-end systems, showcasing a Pareto frontier of different system performances
0 views • 42 slides

Understanding Graphs for Mathematical Interpretation
Explore how students can grasp information through graphical formats and convert it into mathematical graphs. Learn about qualitative graphs, functions, axes, and more. Delve into exercises matching graphs with situations and drawing graphs for given scenarios like plane take-off, biking, and snowbo
0 views • 16 slides
MATLAB Workshop: Graphs, Runtime Analysis, and Plotting Techniques
MATLAB Workshop Part 3 delves into the creation of 2D and 3D plots, along with advanced plotting commands, runtime analysis using tic and toc functions, and the utilization of the MATLAB profiler. The content demonstrates techniques for plotting multiple curves, creating subplots, and visualizing da
0 views • 22 slides

Understanding Runtime Recovery of Web Applications under Zero-Day ReDoS Attacks
This detailed content discusses the critical issue of Runtime Recovery of Web Applications facing Zero-Day ReDoS Attacks. It delves into the significance of regular expressions (regex) in handling HTTP requests, highlighting vulnerabilities and real-world impacts. The research emphasizes the severit
0 views • 31 slides
Understanding Code Execution Graphs and Superblocks in Software Analysis
Explore the concepts of Static Execution Graphs, Dynamic Execution Graphs, Superblocks, hot-path detection, and memory arithmetic in software analysis. Learn about the grouping of blocks, violation tracking, control dependencies, and code behaviors across time through these graphical representations
0 views • 9 slides

Adjacency Labeling Schemes and Induced-Universal Graphs
Adjacency labeling schemes involve assigning L-bit labels to vertices in a graph for efficient edge determination. The concept of induced-universal graphs is explored, where a graph is universal for a family F if all graphs in F are subgraphs of it. Theorems and lower bounds related to adjacency lab
0 views • 24 slides
Efficient Job Scheduling and Runtime Management in DLWorkspace Cloud Computing and Storage Group
Explore the intricate system of job scheduling and runtime management in DLWorkspace, involving SQL server, K8s Master API, Web Portal, Restful API, Cluster Manager, NVIDIA driver plugins, and shared storage. Learn about the process flow from job submission to approval, status monitoring, and device
0 views • 11 slides
Understanding Kinematics Graphs in Physics
Explore the concepts of kinematics graphs through diagrams and descriptions. Learn to interpret distance-time, velocity-time, and speed-time graphs. Understand key parameters such as displacement, initial velocity, final velocity, constant acceleration, and time spent on different parts of a journey
0 views • 33 slides
Visual Analysis: Decisions, Batman's Graphs, COVID Tests, and Flattening the Curve
Explore a collection of images featuring Mythbusters, Batman's original and corrected graphs, alternative Batman heights and weights, COVID tests graph, and a depiction of flattening the curve. Each image provides insight into decision-making, data representation, and visual storytelling. Learn how
0 views • 7 slides
Understanding Graphs and Their Models
Explore the world of graphs through definitions, types, and special features. Learn about vertices, edges, simple and multiple graphs, directed and undirected graphs, and more. Discover the terminology and special types of graphs along with basic concepts and properties.
0 views • 33 slides
Understanding CILK: An Efficient Multithreaded Runtime System
CILK is a multithreaded runtime system designed to develop dynamic, asynchronous, and concurrent programs efficiently. It utilizes a work-stealing thread scheduler and relies on a directed acyclic graph (DAG) model for computations. With a focus on optimizing critical paths and total work, CILK enab
0 views • 44 slides
Introduction to Graph Theory: Exploring Graphs and Their Properties
This content delves into the realm of graph theory, focusing on the fundamental concepts and applications of graphs. It covers topics such as the Seven Bridges of Königsberg problem, types of graphs, vertex degrees, degree sequences, handshaking theorem, and more. Through visual aids and explanatio
0 views • 71 slides
Understanding Directed Graphs and Adjacency Matrices in Discrete Structures
Explore the concepts of binary relations, directed graphs, adjacency matrices, transitive closure, and walks in the context of discrete structures. Learn how vertices, edges, in-degrees, out-degrees, and self-loops are defined in directed graphs. Understand the importance of adjacency matrices in re
0 views • 28 slides
Understanding Graphs in Mathematics and Computer Science
Graphs in mathematics and computer science are abstract data types used to represent relationships between objects. They consist of vertices connected by edges, which can be directed or undirected. Graphs find applications in various fields like electric circuits, networks, and transportation system
0 views • 19 slides

Understanding Graphs in Discrete Mathematics
Graphs are fundamental objects in discrete mathematics that model relationships between pairs of objects. This overview covers the vocabulary, formal definitions, and types of graphs, including directed and undirected graphs. Learn about vertices, edges, adjacency, and more essential concepts in gra
0 views • 18 slides