UK Political Statistics Analysis
In this analysis, we delve into various aspects of UK politics including the combined weight of Prime Ministers, their ages upon entering 10 Downing Street, and the number of parliamentary seats won in General Elections by different parties. The data covers notable figures such as Gordon Brown, David Cameron, Margaret Thatcher, Theresa May, Tony Blair, and John Major, as well as parties like the Conservatives, Labour, Lib Dems, SNP, Plaid Cymru, Independent, Green, and Sinn Féin.

Download Presentation

Please find below an Image/Link to download the presentation.
The content on the website is provided AS IS for your information and personal use only. It may not be sold, licensed, or shared on other websites without obtaining consent from the author. Download presentation by click this link. If you encounter any issues during the download, it is possible that the publisher has removed the file from their server.
E N D
Presentation Transcript
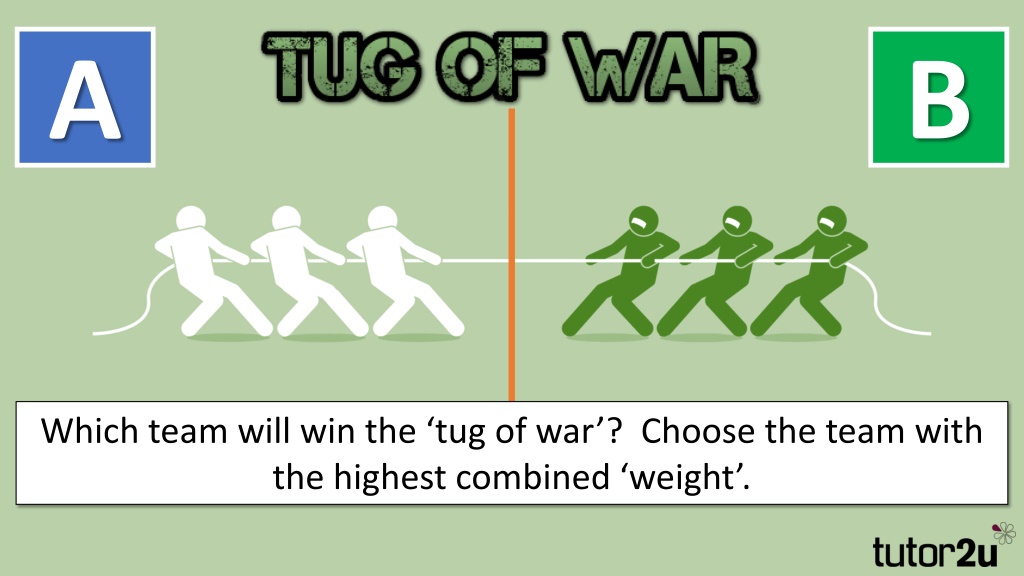
A B Which team will win the tug of war ? Choose the team with the highest combined weight .
A B Gordon Brown David Cameron Margaret Thatcher Theresa May Tony Blair John Major What is the combined age (in years) of these Prime Ministers when they first entered No. 10?
A B 147 159 Gordon Brown Brown Gordon David Cameron Cameron David Margaret Thatcher Thatcher Margaret Theresa May Theresa May Tony Blair Tony Blair John Major John Major 59 56 44 47 44 56 What is the combined age (in years) of these Prime Ministers when they first entered No. 10?
A B Conservative 2005 Conservative 2010 Conservative 2015 Labour 2005 Labour 2010 Labour 2015 What is the combined number of parliamentary seats won in these General Elections?
A B 834 845 Conservative 2005 2005 Conservative Conservative Conservative 2010 2010 Conservative Conservative 2015 2015 Labour 2005 Labour 2005 Labour 2010 Labour 2010 Labour 2015 Labour 2015 355 258 232 198 306 330 What is the combined number of parliamentary seats won in these General Elections?
A B Lib Dems 2010 Lib Dems 2015 Lib Dems 2017 SNP 2010 SNP 2015 SNP 2017 What is the combined number of parliamentary seats won in these General Elections?
A B 97 77 Lib Dems Lib Dems 2010 2010 Lib Dems 2015 2015 Lib Dems Lib Dems Lib Dems 2017 2017 SNP 2010 SNP 2010 SNP 2015 SNP 2015 SNP 2017 SNP 2017 57 8 12 6 56 35 What is the combined number of parliamentary seats won in these General Elections?
A B Lib Dems Plaid Cymru Independent Green Sinn F in DUP What is the combined number of parliamentary seats won in the 2017 General Elections?
A B 18 17 Lib Dems Lib Dems Plaid Cymru Plaid Cymru Independent Independent Green Green Sinn F in Sinn F in DUP DUP 12 4 1 1 7 10 What is the combined number of parliamentary seats won in the 2017 General Elections?
A B Labour Conservative Plaid Cymru SNP Lib Dems DUP What is the combined number (as a %age of total party seat) of seats won by women in the 2017 General Elections?
A B 78 91 Labour Labour Conservative Conservative Plaid Cymru Plaid Cymru SNP SNP Lib Dems Lib Dems DUP DUP 45 21 25 35 33 10 What is the combined number (as a %age of total party seat) of seats won by women in the 2017 General Elections?