Different Classifications and Guidelines for Descriptive Statistics
This content discusses the two broad classifications of statistics - descriptive and inferential. It delves into descriptive statistics, which help organize and summarize numerical data, and explores various ways to categorize them. It covers measures to condense data, central tendency, variability, and relationships in statistics, along with guidelines for critiquing descriptive statistics in research reports.
Download Presentation

Please find below an Image/Link to download the presentation.
The content on the website is provided AS IS for your information and personal use only. It may not be sold, licensed, or shared on other websites without obtaining consent from the author.If you encounter any issues during the download, it is possible that the publisher has removed the file from their server.
You are allowed to download the files provided on this website for personal or commercial use, subject to the condition that they are used lawfully. All files are the property of their respective owners.
The content on the website is provided AS IS for your information and personal use only. It may not be sold, licensed, or shared on other websites without obtaining consent from the author.
E N D
Presentation Transcript
Classifications of Statistics Dr. Selman Al-Kerety
There are two broad classifications of statistics: Descriptive and Inferential.
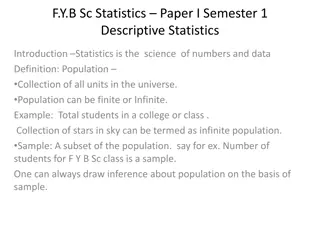
Descriptive statistics Descriptive statistics defined, are those statistics that organize and summarize numerical data gathered from samples.
Descriptive statistics allow the researcher to examine the : Characteristics, of study participants Behaviors of study participants, and Experiences of study participants
ways to categorize descriptive statistics There are many different ways to categorize descriptive statistics such as: A. Measures to condense data B. Measures of central tendency C. Measures of variability D. Measures of relationships.
measures to condense data frequency distributions Values Graphic presentations a figure. Such as: oBar Graph oHistogram oFrequency Polygon Percentages
measures of central tendency the mode the median. The mean
measures of variability Range percentile Standard Deviation Variance
measures of relationships There are several ways to examine a relationship such as : Correlation coefficients, Scatter plots, and Contingency tables
Guidelines for Critiquing Descriptive Statistics 1. What types of descriptive statistics are included in the research report? 2. Were the descriptive statistics appropriate for the level of measurement of the variable(s)? 3. Were measures of central tendency and variability both presented?
Guidelines for Critiquing Descriptive Statistics 4. Do the descriptive statistics clearly present the demographic characteristics of the subjects? 5. Are the descriptive statistics clearly presented in the text? In tables and graphs? 6. Do the descriptive statistics presented in the text agree with those presented in the tables?
Inferential statistics Inferential statistics are based on the laws of probability. Inferential statistics help the researcher determine if the difference found between two groups, such as an experimental and a control group.
purposes of inferential statistics 1. Estimate population parameters from sample data oSampling Distribution of the Mean oConfidence Intervals 2. Test hypotheses. o Choosing a Statistical Test o Level of Significance
Inferential statistical tests can be classified as : Parametric tests require interval or ratio data and assume that the sample data have been taken from populations that are normally distributed and have equal variances. Nonparametric tests can be used with nominal and ordinal data and make no assumptions about the distribution of the population.
Statistical Tests Used In Nursing Research Three of the most common statistical tests used in nursing research are the: t test, Analysis of variance, and chi-square, and are discussed next
t test The t test is a parametric test that examines the difference between the means of two groups. The t test uses the t distribution. One form of the test is used with independent samples and is called the independent t test or independent samples t test or unrelated t test. The dependent t test, also called paired t test or correlated samples t test, is used when scores or values are associated .
Analysis of variance (ANOVA) Analysis of variance (ANOVA) is used to compare the difference among more than two means. The ANOVA is a parametric test that uses the F distribution.
chi-square test The chi-square test is a nonparametric inferential technique that is appropriate for comparing sets of data that are in the form of frequencies or percentages. The frequencies that are obtained or observed are compared to the expected frequencies.
A confidence interval A confidence interval is a range of values that, with a specified degree of probability, is thought to contain the population value. The researcher might establish a 95% confidence interval or a 99% confidence interval
Probability samples are those chosen by a random selection process in which each member of the population has a chance of being in the sample. If nonprobability sampling is used, the researcher has less confidence that the sample is representative of the population.
level of significance (probability level). The probability of rejecting a null hypothesis when it is true; symbolized by lowercase Greek letter alpha (_); also symbolized by p. The most common level of significance used is .05. This means that the researcher is willing to risk being wrong 5% of the time or 5 times out of 100 when rejecting the null hypothesis. More stringent levels of significance are .01 and .001. .
Critical Value A critical value is a cutoff point that denotes the place in a theoretical distribution at which all obtained values from a sample that are equal to or beyond that point are said to be statistically significant. Values beyond the critical value are said to lie in the critical region or region of rejection. If the computed value of a statistic is equal to or greater than the critical value, the null hypothesis is rejected.
effect size An effect size indicates how useful a treatment or intervention was in several studies as indicated by the difference between data from the control and experimental groups.
Guidelines for Critiquing Inferential Statistics 1. Are inferential statistics presented in the research report? 2. If inferential statistics are presented, is enough information presented for the reader to determine whether or not the appropriate tests were used? 3. Is the reader provided with the calculated value of the inferential statistic, the degrees of freedom, and the level of significance that was obtained? 4. Were parametric or nonparametric tests used when the other type would have been more appropriate?
Guidelines for Critiquing Inferential Statistics 5. Are the chosen tests appropriate considering the level of measurement of the variables, the number of groups that were tested, the size of the sample, and so on? 6. Are inferential statistics presented for each hypothesis that was stated in the study? 7. Are the results of inferential tests clearly and thoroughly discussed? 8.Are the results presented both in the text and in the tables?
