Shifting Political Sentiment in Gauteng: Analysis & Insights
Examining 2021 local government election turnout trends in Gauteng & impact on major political parties. Longitudinal & spatial analysis of voting patterns. Unpacking reasons for voter behavior shifts. Media narratives vs. political nuances.
Download Presentation
Please find below an Image/Link to download the presentation.
The content on the website is provided AS IS for your information and personal use only. It may not be sold, licensed, or shared on other websites without obtaining consent from the author. Download presentation by click this link. If you encounter any issues during the download, it is possible that the publisher has removed the file from their server.

Presentation Transcript
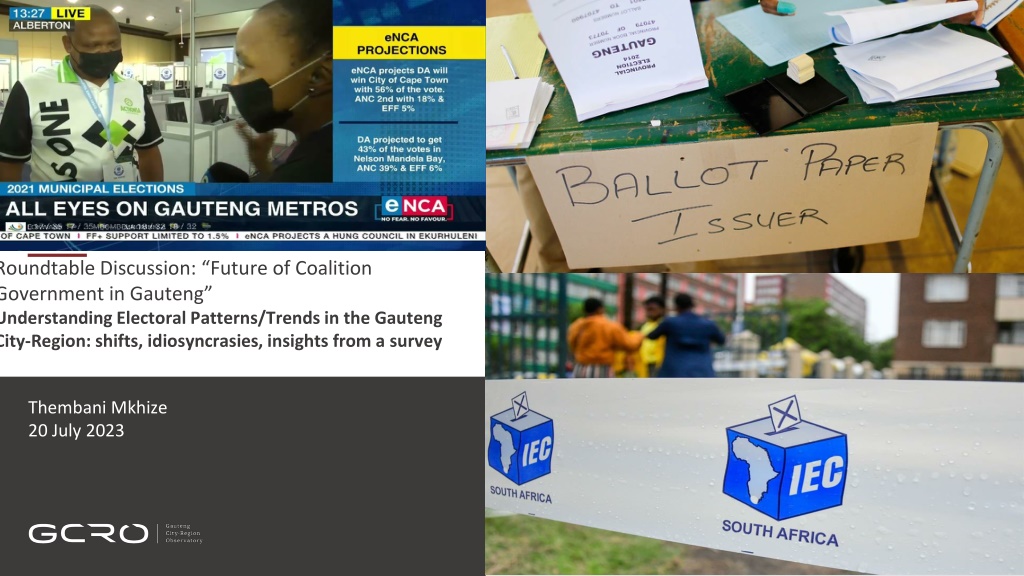
Roundtable Discussion: Future of Coalition Government in Gauteng Understanding Electoral Patterns/Trends in the Gauteng City-Region: shifts, idiosyncrasies, insights from a survey Thembani Mkhize 20 July 2023 *Photographs are just an illustration and do not depict respondents. Simon Wolfson
Introduction - The 2021 local government election relative to previous polls Background and context Central feature of South African electoral politics: municipal polls tend to see relatively lower turnouts in comparison to polls for national and provincial governments (to be further demonstrated) Nevertheless, 2021 local government elections represent dramatic shift in political sentiment, affiliations and identities Number of voters stayed static from previous 2016 municipal polls, and this is evident in the context of the Gauteng City-Region where About 3,6 million (58%) of 6,2 million registered voters cast votes in 2016 municipal elections Only 2,7 million (43%) of 6,2 million registered voters cast votes in 2021 municipal elections, thus driving turnout down by 14,3% (Independent Electoral Commission, 2021) Lowest turnout of any election in post-democratic history (Runciman and Becker, 2021; Runciman et al 2021) Paper seeks to do the following Longitudinal analysis of voting patterns in Gauteng via tabulation of Proportional Representation (PR) votes won by each of the top political parties in the province since 2011 Spatial analysis of these by mapping distribution of PR votes won by each of the top political parties in the province (detailed dot density maps) Shed some light on possible reasons for big shift in political sentiment(s) within Gauteng (via drawing on some results from the GCRO s biennial Quality of Life (QoL) Survey
Introduction - The 2021 local government election relative to previous polls (continued) Background and argument(s) In the media, there have been many stories about the 2021 local government elections having been the most disastrous elections especially for the ruling ANC (Runciman and Bekker 2021a; Runciman et al 2021; The Guardian 2021; Dludla and Winning 2021) Yet, media not depicting full story of the current political terrain there are multiple nuances as to why voter turnout and voter behaviour are the way they (currently) are Paper attempts to unpack some of these by arguing/showing that Although voter turnout was unevenly distributed across Gauteng, it was relatively low all over the city-region Highest proportion of missing voters in ANC strongholds, relatively lower proportion of missing voters in DA strongholds Still, all major/established parties (most notably the ANC and the DA) saw significant declines from previous municipal polls; minority parties saw some notable gains (VF+ and the IFP) Yet, biggest winner was arguably ActionSA, a new cross-race, cross-class political player that performed relatively well in both township and suburban contexts Attempts to account for lower voter turnout in 2021 What do the kinds of tectonic political shifts we see say about the polity and future of Gauteng?
The 2021 local government election results Huge drop in turnout, decline for all the major parties, notable gains for minority parties 2011 (Local) 2014 2016 (Local) 2019 2021 (Local) Change 2016-2021 (Provincial) (Provincial) ANC 1 855 613 (60,5%) 2 348 564 (53,6%) 1 637 585 (46,1%) 2 168 253 (50,2%) 957 329 (35,5%) -680 256 (-10,6%) DA 1 021 973 (33,3%) 1 349 001 (30,8%) 1 321 432 (37,2%) 1 185 743 (27,5%) 752 769 (27,9%) -568 663 (-9,3%) EFF NA 451 318 (10,3%) 400 335 (11,3%) 634 387 (14,7%) 308 303 (11,4%) -92 032 (+0,2%) VF+ 22 006 (0,7%) 52 436 (1,2%) 40 714 (1,1%) 153 844 (3,6%) 112 989 (4,2%) +72 275 (+3,0%) IFP 30 130 (1,0%) 34 240 (0,8%) 34 532 (1,0%) 38 263 (0,9%) 35 840 (1,3%) +1 308 (+0,4%) ActionSA 279 256 (10,4%) +279 256 (+10,4%) Spoilt ballots 38 771 42 261 51 339 37 411 38 290 -13 908 Total votes cast 3 107 134 4 424 424 3 602 786 4 357 348 2 694 545 -908 241 Reg voters 5 592 676 6 063 739 6 234 822 6 381 220 6 195 753 -39 069 % turnout 56% 73% 58% 68% 43% -14,3%
Distribution of missing voters across Gauteng in 2021 Highest percentages in traditionally ANC wards, relatively lower percentages in traditionally DA wards %age of registered voters who did not vote missing voters or registered non-voters was not evenly distributed across Gauteng wards On the surface: all wards show relatively high %ages of registered non-voters (most are above 40%) Yet, below the surface, highest %ages of missing voters were registered in various non-white sections of sub-places across Gauteng, viz Township areas (Soshanguve, Mabopane, Katlehong, Soweto) Inner-city areas (Pretoria Central, inner-city Johannesburg) Informal settlements (Diepsloot) More rural areas (Hammanskraal, Bronkhorstspruit) The aforesaid are traditionally the political heartland of the ruling African National Congress (ANC) Interestingly, areas traditionally governed by the main opposition the Democratic Alliance (DA) enjoyed much higher %ages of registered voters e.g. Suburban areas or northern suburbs (Sandton, Midrand, Centurion) Midvaal (municipality traditionally governed by the DA)
Possible reasons for generally low turnout in SAs metros Complex and multifaceted Reasons range From individual factors (health constraints; not being able to get to voting station on election day) and Administrative factors (not being in right voting station), both of which were likely exacerbated by the COVID-19 pandemic Through to higher levels of political disillusionment & disengagement (apathy) However, relative weight of factors in driving lower turnout is debatable Still, a recent telephonic survey conducted by Runciman and Becker (2021) is instructive 3,905 telephonic interviews with both voters & non-voters in 5 of SA s 8 metropolitan municipalities (Ethekwini/Durban, Johannesburg, Nelson Mandela Bay, Tshwane, Cape Town) Asked respondents about their participation in the 2016 and 2021 municipal polls as well as in the 2019 provincial polls Study finds that low voter turnout was driven by 5 factors, viz: Individual factors (being too busy on election day, constrainment by poor health or care responsibilities) Administrative barriers (ID issues or long queues at voting station) Fluidity of voter attitudes (many voters who did not vote in prior elections voted in 2021; many voters who voted in prior elections did not vote in 2021 polls) Dissatisfaction with local government performance, disillusionment, disinterest (apathy) Lack of political alignment (inability to find political party to identify with)
Reasons for generally low turnout in Gauteng Insights from the QoL Survey Sliding levels of satisfaction with all spheres of government The Gauteng City-Region Observatory (GCRO) Quality of Life (QoL) Survey, conducted every two years since 2009, gives unique perspective on changing political attitudes and perceptions in Gauteng Survey contains host of pertinent governance-related variables, including satisfaction with service delivery and government, attitudes towards politics, public trust (more than 200 questions) 13,616 adult participants carefully sampled in Gauteng s 529 wards for QoL 6 Survey Most recent Quality of Life 6 Survey (2020/21) pointed to large decline in levels of satisfaction with, and trust in, local government and other spheres of government %age of respondents satisfied with national gov t fell from 42% in 2017/18 to 33% in 2020/21 In 2017/18, 44% of respondents were satisfied with provincial gov t; in 2020/21, only 29% said they were satisfied a decline of 15 percentage points Satisfaction with local gov t has decreased dramatically from 37% to 26% - and dissatisfaction has also increased dramatically from 44% to 57% on average Satisfaction with local gov t has historically been the lowest (Mushongera et al 2021) The large decline in levels of satisfaction may have negatively impacted voter turnout & who Gauteng residents voted for (Mushongera et al 2021)
Insights from QoL Survey - Sliding satisfaction with government Satisfaction with national government has dropped significantly since the last QoL 2011 6 33 19 25 17 2013/14 6 38 11 28 17 Very satisfied Satisfied 2015/16 9 30 19 25 17 Neutral Dissatisfied 2017/18 7 35 16 29 12 Very dissatisfied 2020/21 6 27 16 31 21 0% 20% 40% 60% 80% 100%
Insights from QoL Survey - Sliding satisfaction with government Satisfaction with provincial government has declined the most, despite apparent gains in 2017/18 2011 4 29 22 26 18 2013/14 3 37 13 31 17 Very satisfied Satisfied 2015/16 7 32 23 23 15 Neutral Dissatisfied 2017/18 5 39 19 28 9 Very dissatisfied 2020/21 4 25 18 33 19 0% 20% 40% 60% 80% 100%
Insights from QoL Survey - Sliding satisfaction with government Satisfaction with local government historically lowest of the 3 spheres, and has dropped further in 2020/21 2011 5 27 19 26 22 2013/14 3 34 12 31 20 Very satisfied Satisfied 2015/16 6 28 21 26 19 Neutral Dissatisfied 2017/18 4 33 19 30 14 Very dissatisfied 2020/21 4 22 16 34 24 0% 20% 40% 60% 80% 100%
Insights from QoL Survey - Sliding satisfaction with government Fluctuating but low levels of satisfaction with local government: 2011, 2013/14, 2015/16, 2017/18, 2020/21 100 80 % respondents 60 56 55 46 45 44 43 43 42 42 42 41 38 38 38 38 37 37 40 36 36 36 35 34 34 34 34 33 33 33 33 33 32 31 31 31 30 29 28 28 27 27 26 25 25 24 23 22 21 21 20 16 9 0 Ekurhuleni Johannesburg Tshwane Emfuleni Lesedi Midvaal Merafong Mogale City Rand West GAUTENG 2011 2013/14 2015/16 2017/18 2020/21 See QoL report for more information
Insights from QoL Survey - Sliding satisfaction with government Factors shaping satisfaction: Low levels of trust in government and low confidence in the future 24% Say they trust the current leaders of government Agree or disagree: the country is going in the wrong direction 2011 21 39 13 23 4 2013/14 17% Agree that leaders from different parts of government in Gauteng work well together 18 42 10 26 4 Strongly agree Agree 2015/16 23 38 16 18 5 Neither Disagree 2017/18 18 42 14 21 4 Strongly disagree 18% Agree that leaders include most stakeholders in govt. decision-making 2020/21 24 39 16 17 3 0% 20% 40% 60% 80% 100%
Insights from QoL Survey - Sliding satisfaction with government Factors shaping satisfaction: Concerns around corruption. Other variables What is government doing the worst at? 52 18 13 6 3 7 0% 20% 40% 60% 80% 100% Job creation Keeping government free of corruption Housing & basic services Economic growth Safety & security Others What is the main reason people live in poverty? 2 2 2 65 15 8 7 0% Lack of jobs Poor education South Africa's history Other 20% 40% 60% 80% 100% Corrupt / incompetent government Laziness Drugs
Performance of main parties between 2016 and 2021 Dramatically lower turnout, losses for all big political parties in their traditional heartlands At first glance, the ANC and the DA remain the most popular parties within their strongholds ANC has presence in suburbs, but still predominates in informal settlements & townships; DA has presence in townships, but still dominates in suburban areas. Very little evidence to suggest that the ANC has grown in suburban areas, or that the DA has grown in township and informal areas Overall lower turnout & declines for established parties clearly visible in noticeably thinner carpet of dots across Gauteng
Performance of main parties between 2016 and 2021 (continued) Dramatically lower turnout, losses for all big political parties in their traditional heartlands Zooming in on an area of interest focused on Soweto and northern suburbs of Johannesburg makes decline in voter turnout & losses suffered by big political parties all the more visible
Performance of main political parties in 2021 (continued) ActionSA arguably biggest winner in 2021 local government elections Dramatic arrival on political stage Achieved success in township and informal areas (traditionally stronghold of the ANC) as well as suburban areas (historically voter base of the DA) Has clear presence in Soweto, Katlehong, inner-city Johannesburg, Pretoria Central, Alexandra, Soshanguve and Hammanskraal Gained 10.4% of vote in Gauteng notwithstanding fact that it did not compete outside Gauteng s 3 metropolitan municipalities Across the 3 metros, ActionSA s dots concentrate most in Johannesburg and least in Ekurhuleni Won support across the socio-economic and race spectrum Yet, a need for research inquiry into ActionSA s multidimensional appeal & the underlying politics that enabled it to capture significant cross-race, cross-class support
Concluding Remarks What do these political shifts possibly mean for Gauteng s future & attempts at social cohesion? None of SA s dominant political parties can claim to have won significantly more voter sympathy at expense of others in 2021, regardless of how complicated post-election negotiations have resolved to deliver new coalition governments for most of Gauteng s larger municipalities Are coalition governments to become the staple of Gauteng s political terrain? Given the DA-led coalition in Gauteng s 3 metros Johannesburg, Tshwane & Ekurhuleni Are coalition governments stable and sustainable over time? Given ActionSA s Herman Mashaba s stance on foreign nationals and the support the new party has amassed in the 3 metros to what extent does the new party s rise pose a threat to social cohesion in the Gauteng City-Region? To what extent does ActionSA s political rise in 2021 elections signal xenophobic tendencies & attitudes in Gauteng (generally) & the 3 metros (particularly)? Especially against the context of past xenophobic episodes & what is happening currently in Gauteng localities (violent anti-immigrant Operation Dudula marches)
Concluding Remarks What do these political shifts possibly mean for Gauteng s future & attempts at social cohesion? Dludla, N. and Winning, A. (2021). South Africa s ANC support slides further in worst election result, in Reuters, 5 December, INTERNET: https://www.reuters.com/world/africa/anc-records-worst-poll-result-admits-safricans-disappointed-with-party-2021-11- 04/, accessed 15-11-2021. Independent Electoral Commission (2021). Municipal election results. https://results.elections.org.za/home/Downloads/ME- Results/, accessed 15-11-2021. de Kadt, J., Hamann, C., Mkhize, S. P. and Parker, A. (2021). Quality of Life Survey 6 (2020/21): Overview Report. Johannesburg: Gauteng City-Region Observatory (GCRO). Mushongera, D., G tz, G., Khanyile, S., Mkhize, T., & Mosiane, N. (2021). Government performance and satisfaction with government. In J. de Kadt, C. Hamann, S.P. Mkhize & A. Parker (Eds.), Quality of Life Survey 6 (2020/21): Overview Report (Section 12). Johannesburg: Gauteng City-Region Observatory. Runciman, C. and Bekker, M. (2021a). Five factors that drove low voter turnout in SA s 2021 elections, in Moneyweb, 12 December, 2021. INTERNET: https://www.moneyweb.co.za/news/south-africa/here-are-five-factors-that-drove-low-voter-turnout- in-south-africas-2021-elections/. Accessed 13 December 2021. Runciman, C., Bekker, M. and Mbeche, C. (2021b). Analysing voter abstention in the 2021 local government elections: A view from five metropolitan municipalities. Centre for Social Change, University of Johannesburg. INTERNET: https://www.kas.de/documents/261596/10543300/Voter+abstention.pdf/f68bc266-00e4-8070-f074- 3b466ac5119f?version=1.0&t=1638354848974, accessed 13 December 2021. The Guardian (2021). 3 November, 2021. South Africa s ANC on course for worst ever electoral performance in local polls, INTERNET: https://www.theguardian.com/world/2021/nov/02/south-africas-anc-on-course-for-worst-ever-electoral-performance- in-local-polls, accessed 13 December 2021.


")