Statistics Analysis of Height Data from Grouped Frequency Table
Given a grouped frequency table showing the height distribution of 30 students, we need to calculate various statistics including minimum, maximum, range, mean, and standard deviation. The process involves setting up the calculator, entering data with frequencies, ensuring the calculator is in the right mode, then performing the necessary statistical calculations.

Download Presentation

Please find below an Image/Link to download the presentation.
The content on the website is provided AS IS for your information and personal use only. It may not be sold, licensed, or shared on other websites without obtaining consent from the author. Download presentation by click this link. If you encounter any issues during the download, it is possible that the publisher has removed the file from their server.
E N D
Presentation Transcript
Finding Statistics from a Grouped frequency table
130 - 140 140 150 150 160 160 170 170 180 Height (x cm) 5 7 8 6 4 Frequency The table shows the height of 30 students Find the (i) Min (ii) Max (iii) Range (iv) Mean (v) Standard Deviation from the calculator We first need to make sure the calculator is CLeaR of all previous content Finding Statistics from a Grouped frequency table
130 - 140 140 150 150 160 160 170 We first need to make sure the calculator is CLeaR of all previous content 170 180 Height (x cm) 5 7 8 6 4 Frequency The table shows the height of 30 students Find the (i) Min (ii) Max (iii) Range (iv) Mean (v) Standard Deviation from the calculator 3: All Yes Reset All Finding Statistics from a Grouped frequency table
130 - 140 140 150 150 160 160 170 170 180 Height (x cm) 5 7 8 6 4 Frequency The table shows the height of 30 students Find the (i) Min (ii) Max (iii) Range (iv) Mean (v) Standard Deviation from the calculator We need to SETUP the calculator to allow us to input Stat with frequency ON We need to SETUP the calculator to allow us to input Stat with frequency ON Finding Statistics from a Grouped frequency table
130 - 140 140 150 150 160 160 170 170 180 Height (x cm) 5 7 8 6 4 Frequency Statistical and Regression Calculations The table shows the height of 30 students Find the (i) Min (ii) Max (iii) Range (iv) Mean (v) Standard Deviation from the calculator Put the calculator into STAT mode Finding Statistics from a Grouped frequency table
135 145 155 165 175 130 - 140 140 150 150 160 160 170 170 180 Height (x cm) 5 7 8 6 4 Frequency The table shows the height of 30 students Find the (i) Min (ii) Max (iii) Range (iv) Mean (v) Standard Deviation from the calculator We only have 1 variable so Select Enter the number column first pressing after each one. (the frequency automatically sets to 1) Go to the top of the next column Enter each frequency pressing After each one Once they have all been entered press Finding Statistics from a Grouped frequency table
130 - 140 140 150 150 160 160 170 170 180 Height (x cm) 5 7 8 6 4 Frequency The table shows the height of 30 students Find the (i) Min (ii) Max (iii) Range (iv) Mean (v) Standard Deviation from the calculator Finding Statistics from a Grouped frequency table
130 - 140 140 150 150 160 160 170 170 180 Height (x cm) 5 7 8 6 4 Frequency The table shows the height of 30 students Find the (i) Min (ii) Max (iii) Range (iv) Mean (v) Standard Deviation from the calculator We now need to analyse the statistics we have input Finding Statistics from a Grouped frequency table
1: Type 2: Data change the type of data Edit the data 3: Sum 4: Var 5: Min and max of x 1: How many terms 2: Mean of data 3: Population Standard Deviation 4: Sample Standard Deviation Once you have chosen your required output you need to press
130 - 140 140 150 150 160 160 170 (i) Min 170 180 Height (x cm) 5 7 8 6 4 Frequency (ii) Max = 135 The table shows the height of 30 students Find the (i) Min (ii) Max (iii) Range (iv) Mean (v) Standard Deviation from the calculator = 175 (iii) Range (iv) Mean = 175 135 = 50 = 154 (i) Standard Deviation = 12.74 Finding Statistics from a Grouped frequency table
E.g 1 The frequency table of the monthly salaries of 20 people is shown below. salary(in ) 3500 4000 4200 4300 frequency 5 8 5 2 a) Calculate the mean of the salaries of the 20 people. b) Calculate the standard deviation of the salaries of the 20 people.
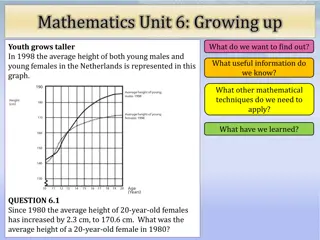
E.g 2. The following table shows the grouped data, in classes, for the heights of 50 people. height (in cm) - classes 120 ? < 130 130 ? < 140 140 ? < 150 150 ? < 160 160 ? < 170 frequency 2 5 25 10 8 a) Calculate the mean of the salaries of the 20 people. b) Calculate the standard deviation of the salaries of the 20 people
E.g3. Consider the following three data sets A, B and C. A = {9,10,11,7,13} B = {10,10,10,10,10} C = {1,1,10,19,19} a) Calculate the mean of each data set. b) Calculate the standard deviation of each data set. c) Which set has the largest standard deviation? d) Is it possible to answer question c) without calculations of the standard deviation?
E.g 4.A given data set has a mean and a standard deviation . a) What are the new values of the mean and the standard deviation if the same constant k is added to each data value in the given set? Explain. b) What are the new values of the mean and the standard deviation if each data value of the set is multiplied by the same constant k? Explain. E.g 5 If the standard deviation of a given data set is equal to zero, what can we say about the data values included in the given data set?