Understanding Data Distribution and Analysis in AP Statistics
Explore the concepts of percentiles, standard scores, and data transformation in AP Statistics. Learn to interpret data distributions, calculate percentiles, and examine the relationship between percentiles and quartiles. Engage in activities to analyze class heights, calculate z-scores, and understand the impact of unit conversions on statistical measures. Dive into ogives and cumulative frequency graphs to gain insights into data representation techniques in statistics.

Download Presentation

Please find below an Image/Link to download the presentation.
The content on the website is provided AS IS for your information and personal use only. It may not be sold, licensed, or shared on other websites without obtaining consent from the author. Download presentation by click this link. If you encounter any issues during the download, it is possible that the publisher has removed the file from their server.
E N D
Presentation Transcript
Data Locations AP Statistics September 08, 2016
Goals By the end of this section, you should be able to: Find and interpret the percentile of an individual value within a distribution of data. Estimate percentiles and individual values using a cumulative relative frequency graph. Find and interpret the standardized score (z- score) of an individual value within a distribution of data. Describe the effect of adding, subtracting, multiplying by, or dividing by a constant on the shape, center, and spread of a distribution of data.
Activity Take the heights of each student (in inches) and place them on a number line from 58 inches to 78 inches. Make a dot plot. What percent of the students have a height less than yours? (This is percentile.)
Activity With a partner, find the mean and standard deviation of the class heights. Is your height above or below the mean? How many standard deviations is it from the mean? (This is your z-score.)
Activity What would happen if we converted the height to centimeters? (1 inch = 2.54 centimeters.) How would the unit change affect measures of center, spread, and location (percentile and z-score) that you calculated?
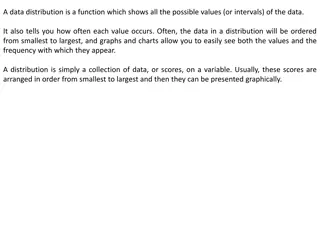
Percentiles Definition: The percentage of observations less than a specific data point.
Finding Percentile Here are the scores of 12 exams taken in a class. The bold score is Jenny s. 79, 81, 77, 74, 86, 90, 79, 93, 75, 80, 67, 72. Find the percentile Jenny scored in.
Percentiles What is the relationship between percentiles and quartiles?
Ogives Cumulative relative frequency graphs.
Ogives Find the ages of everyone in the class and record their frequency. (How often they occur) Find their relative frequency. (Number of occurrences / total) Find their cumulative frequency. (Each frequency added to previous frequency.)
Ogives Find their cumulative relative frequency. Create an ogive (cumulative relative frequency graph). Extra time? Work on homework!